. 2013 Apr;19(4):542-50.
doi: 10.3201/eid1904.120117.

Cost-effectiveness of novel system of mosquito surveillance and control, Brazil

Affiliations

Cost-effectiveness of novel system of mosquito surveillance and control, Brazil

Kim M Pepin et al. Emerg Infect Dis. 2013 Apr.

Abstract

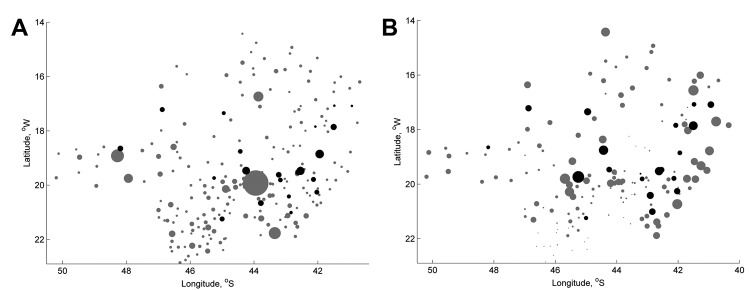
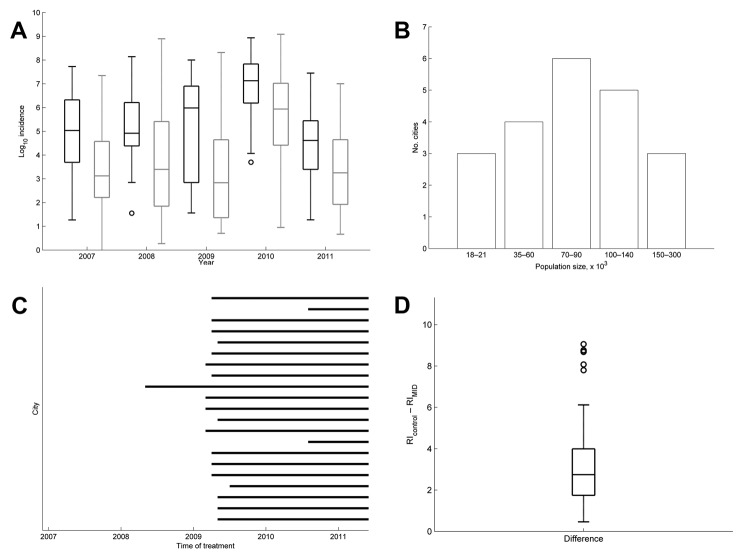
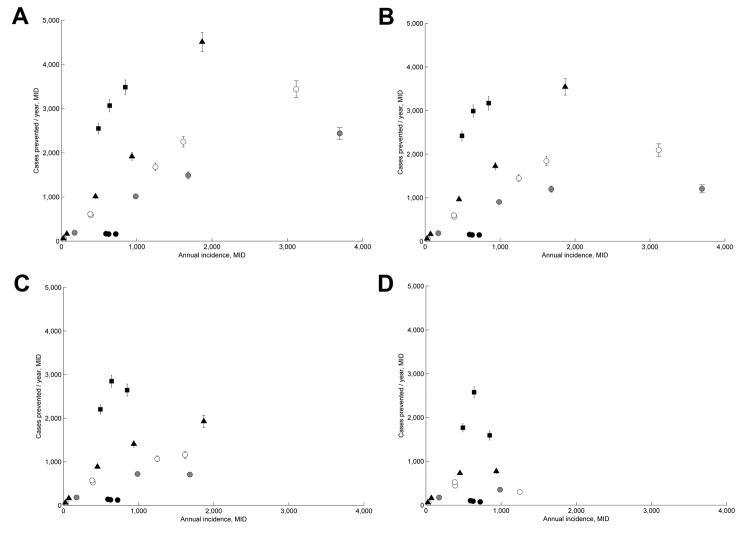
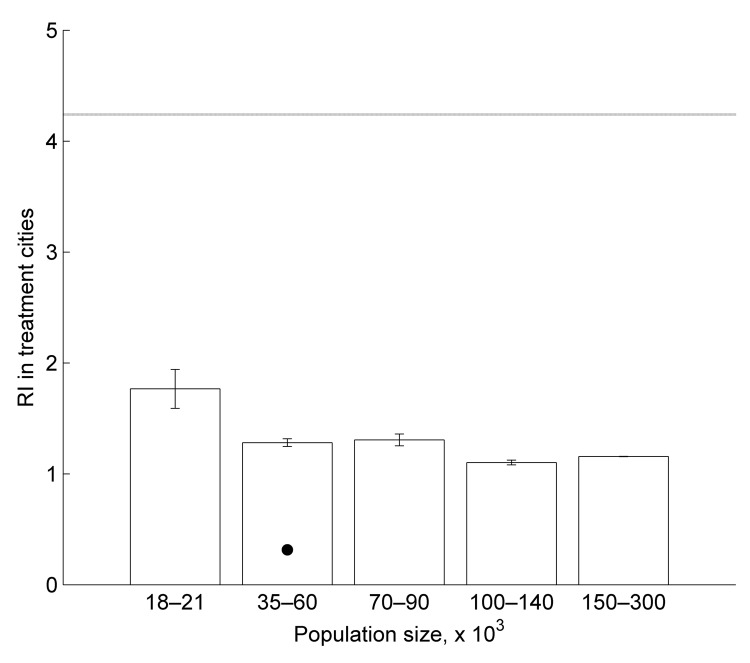
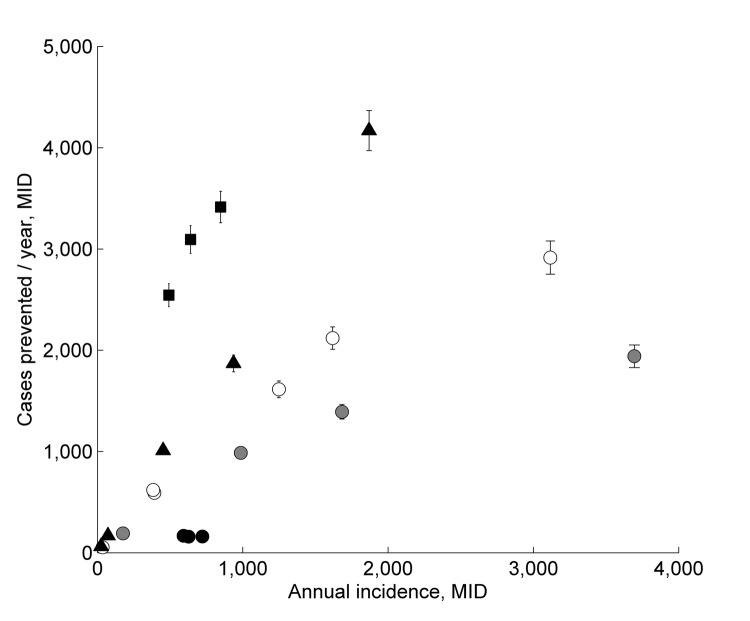
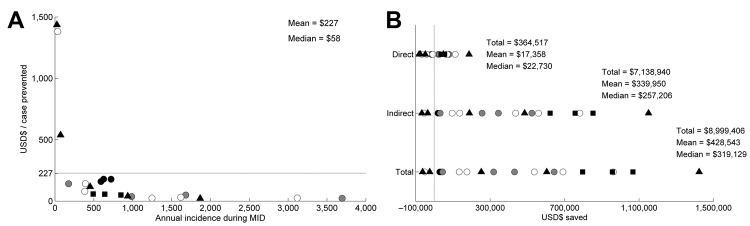
Of all countries in the Western Hemisphere, Brazil has the highest economic losses caused by dengue fever. We evaluated the cost-effectiveness of a novel system of vector surveillance and control, Monitoramento Inteligente da Dengue (Intelligent Dengue Monitoring System [MID]), which was implemented in 21 cities in Minas Gerais, Brazil. Traps for adult female mosquitoes were spaced at 300-m intervals throughout each city. In cities that used MID, vector control was conducted specifically at high-risk sites (indicated through daily updates by MID). In control cities, vector control proceeded according to guidelines of the Brazilian government. We estimated that MID prevented 27,191 cases of dengue fever and saved an average of $227 (median $58) per case prevented, which saved approximately $364,517 in direct costs (health care and vector control) and $7,138,940 in lost wages (societal effect) annually. MID was more effective in cities with stronger economies and more cost-effective in cities with higher levels of mosquito infestation.

Keywords: Aedes aegypti; Brazil; cost-effectiveness; dengue; dengue virus; mosquito control; mosquito surveillance; viruses.


Figures

Figure 1
Figure 1
Spatial distribution of 21 cities tested with Monitoramento Inteligente da Dengue (Intelligent Dengue Monitoring System [MID]), Minas Gerais, Brazil, 2009–2011. A). Size of city centroids (n = 218) (circles) is proportional to population size. B) Size of city centroids (n = 147) (circles) is proportional to total dengue fever incidence during 2007–2011. Gray circles indicate cities that never implemented MID, and black circles indicate cities that implemented MID during mid-2009–June 2011. Areas of higher and lower total incidence are positively clustered with each other (Moran’s I, p<0.0001). Cities that implemented MID and those that had not implemented MID are distributed throughout areas of high and low incidence. Only cities with populations >15,000 are shown. Incidence data were not available for all cities.
Figure 2
Figure 2
Changes in incidence of dengue fever in 21 cities that implemented Monitoramento Inteligente da Dengue (Intelligent Dengue Monitoring System [MID]), Minas Gerais, Brazil, mid-January 2007–June 2011. A) Annual incidence in 21 cities that implemented MID (bars outlined in black) and 147 cities that had not implemented MID (bars outlined in gray). Horizontal lines in boxplots indicate medians of 1,000 medians. Whiskers indicate ± 2.7 SD. Circles indicate points that fall outside ± 2.7 SD. B) Distribution of population sizes in cities that implemented MID. C) Time that MID was implemented in each city. D) Median relative increase (RI) in incidence for cities that implemented MID versus cities that had not implemented MID. RI was calculated as the sum of monthly incidence after MID was implemented divided by the sum of monthly incidence before MID was implemented for the same number of months. For cities that implemented MID, the median is a single value for the 21 cities. For cities that had not implemented MID, 21 cities with the same distribution of population sizes as MID cities were selected at random 1,000 times and their median relative differences during the same set of time frames were calculated. Horizontal line in the boxplot indicates median of 1,000 medians. Whiskers indicate ± 2.7 SD. Circles indicate points that fall outside ± 2.7 SD.
Figure 3
Figure 3
Effectiveness of Monitoramento Inteligente da Dengue (Intelligent Dengue Monitoring System [MID]), Minais Gerais, Brazil, mid-2009–mid 2011. Predicted number of dengue fever cases prevented per year during the time of MID are plotted against the annual incidence of dengue fever in each city during the same time. K is a percentage value of the population size in a city. Error bars indicate 2 SE. A) 29,533 cases were prevented when K = 50%. B) 24,263 cases were prevented when K = 20%. C) 16,578 cases were prevented when K = 10%. D) 9,219 cases were prevented when K = 5%. Shaded symbols distinguish population size classes as follows: black circles indicate 18,000–21,000; gray circles indicate 35,000–60,000; white circles indicate 70,000–90,000; triangles indicate 100,000–140,000; squares indicate 150,000–300,000.
Figure 4
Figure 4
Mean relative difference in incidence (RI) of dengue fever cases for treatment cities grouped by population size using Monitoramento Inteligente da Dengue (Intelligent Dengue Monitoring System), Minas Gerais, Brazil, mid-2009–mid 2011. Horizontal line indicates mean RI for the 1,000 median RI of control city sets. Error bars indicate 2 SD. Error bars for the largest population size group are too small to be shown. The black dot is an outlier that was excluded from the general linear model results.
Figure 5
Figure 5
Effectiveness of Monitoramento Inteligente da Dengue (Intelligent Dengue Monitoring System [MID]), Minas Gerais, Brazil, mid-2009–mid-2011. Predicted number of dengue fever cases prevented per year during the time of MID are plotted against the annual incidence of dengue fever cases in each city during the same time. A total of 27,191 cases were prevented. Cases prevented/year = predicted cases in the absence of MID (E) – observed annual cases (O), where Ei = diOi(1 – Oi/Ki), d is the difference between median relative difference (RI) in incidence in control cities (mean 1,000 datasets) minus the RI in each treatment city, and K is 30% of the population size in city i. Error bars indicate 2 SE of the number of predicted cases that were prevented (points without bars are shown because the SEs are smaller than the size of the point). Shaded symbols distinguish population size classes as follows: black circles indicate 18,000–21,000; gray circles indicate 35,000–60,000; white circles indicate 70,000–90,000; triangles indicate 100,000–140,000; squares indicate 150,000–300,000.
Figure 6
Figure 6
Cost-effectiveness of and savings from Monitoramento Inteligente da Dengue (Intelligent Dengue Monitoring System [MID]), Minas Gerais, Brazil, mid-2009–mid-2011. A) For cost-effectiveness, the number of US dollars (USD$) spent per dengue fever case prevented is plotted against the annual incidence of dengue fever cases during MID for the city. Each point represents cost-effectiveness for a city. Points are coded by population size classes. Horizontal line indicates average cost-effectiveness ($227) per case prevented. B) Savings for each cost component from the benefits of MID. Direct savings include only health care, nonmedical direct savings, and vector control savings. Indirect savings include only savings in the work force. Total savings include direct and indirect savings. Negative values indicate dollars lost because of implementing MID. Vertical line indicates 0. Shaded symbols distinguish population size classes as follows: black circles indicate 18,000–21,000; gray circles indicate 35,000–60,000; white circles indicate 70,000–90,000; triangles indicate 100,000–140,000; squares indicate 150,000–300,000.

Similar articles

Cited by

References

    1. Guzman MG, Halstead SB, Artsob H, Buchy P, Jeremy F, Gubler DJ, et al. Dengue: a continuing global threat. Nat Rev Microbiol. 2010;8(Suppl):S7–16. 10.1038/nrmicro2460 - DOI - PMC - PubMed
    1. Nogueira RM, de Araujo JM, Schatzmayri HG. Dengue viruses in Brazil, 1986–2006. Rev Panam Salud Publica. 2007;22:358–63. 10.1590/S1020-49892007001000009 - DOI - PubMed
    1. Teixeira MG, Costa MD, Barreto F, Barreto ML. Dengue: twenty-five years since reemergence in Brazil. Cad Saude Publica. 2009;25:S7–18. 10.1590/S0102-311X2009001300002 - DOI - PubMed
    1. Rodriguez-Barraquer I, Cordeiro MT, Braga C, de Souza WV, Marques ET, Cummings DA. From re-emergence to hyperendemicity: the natural history of the dengue epidemic in Brazil. PLoS Negl Trop Dis. 2011;5:e935. 10.1371/journal.pntd.0000935 - DOI - PMC - PubMed
    1. Figueiredo LT. Dengue in Brazil during 1999–2009: a review. Dengue Bull. 2010;34:6–12.

Publication types

LinkOut - more resources