

A comprehensive analysis of adiponectin QTLs using SNP association, SNP cis-effects on peripheral blood gene expression and gene expression correlation identified novel metabolic syndrome (MetS) genes with potential role in carcinogenesis and systemic inflammation
- PMID: 23628382
- PMCID: PMC3643849
- DOI: 10.1186/1755-8794-6-14
A comprehensive analysis of adiponectin QTLs using SNP association, SNP cis-effects on peripheral blood gene expression and gene expression correlation identified novel metabolic syndrome (MetS) genes with potential role in carcinogenesis and systemic inflammation
Abstract
Background: Metabolic syndrome (MetS) is an aberration associated with increased risk for cancer and inflammation. Adiponectin, an adipocyte-produced abundant protein hormone, has countering effect on the diabetogenic and atherogenic components of MetS. Plasma levels of adiponectin are negatively correlated with onset of cancer and cancer patient mortality. We previously performed microsatellite linkage analyses using adiponectin as a surrogate marker and revealed two QTLs on chr5 (5p14) and chr14 (14q13).
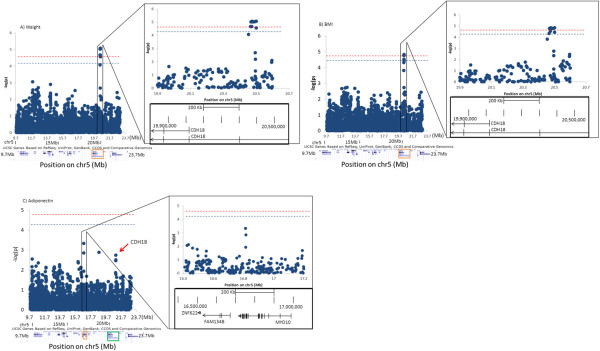
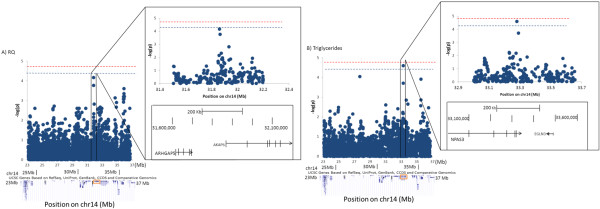
Methods: Using individuals from 85 extended families that contributed to the linkage and who were measured for 42 clinical and biologic MetS phenotypes, we tested QTL-based SNP associations, peripheral white blood cell (PWBC) gene expression, and the effects of cis-acting SNPs on gene expression to discover genomic elements that could affect the pathophysiology and complications of MetS.
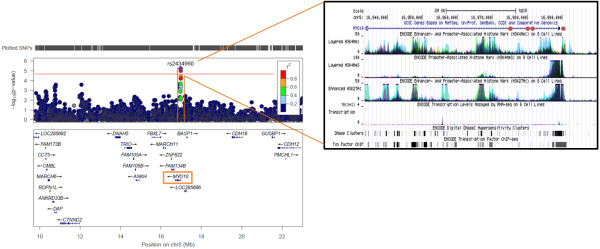
Results: Adiponectin levels were found to be highly intercorrelated phenotypically with the majority of MetS traits. QTL-specific haplotype-tagging SNPs associated with MetS phenotypes were annotated to 14 genes whose function could influence MetS biology as well as oncogenesis or inflammation. These were mechanistically categorized into four groups: cell-cell adhesion and mobility, signal transduction, transcription and protein sorting. Four genes were highly prioritized: cadherin 18 (CDH18), myosin X (MYO10), anchor protein 6 of AMPK (AKAP6), and neuronal PAS domain protein 3 (NPAS3). PWBC expression was detectable only for the following genes with multi-organ or with multi-function properties: NPAS3, MARCH6, MYO10 and FBXL7. Strong evidence of cis-effects on the expression of MYO10 in PWBC was found with SNPs clustered near the gene's transcription start site. MYO10 expression in PWBC was marginally correlated with body composition (p = 0.065) and adipokine levels in the periphery (p = 0.064). Variants of genes AKAP6, NPAS3, MARCH6 and FBXL7 have been previously reported to be associated with insulin resistance, inflammatory markers or adiposity studies using genome-wide approaches whereas associations of CDH18 and MYO10 with MetS traits have not been reported before.
Conclusions: Adiponectin QTLs-based SNP association and mRNA expression identified genes that could mediate the association between MetS and cancer or inflammation.
Figures
Similar articles
-
QTL-based association analyses reveal novel genes influencing pleiotropy of metabolic syndrome (MetS).Obesity (Silver Spring). 2013 Oct;21(10):2099-111. doi: 10.1002/oby.20324. Epub 2013 May 29. Obesity (Silver Spring). 2013. PMID: 23418049 Free PMC article.
-
A genome-wide association study reveals a quantitative trait locus of adiponectin on CDH13 that predicts cardiometabolic outcomes.Diabetes. 2011 Sep;60(9):2417-23. doi: 10.2337/db10-1321. Epub 2011 Jul 19. Diabetes. 2011. PMID: 21771975 Free PMC article.
-
Fatty acid binding protein 3 (fabp3) is associated with insulin, lipids and cardiovascular phenotypes of the metabolic syndrome through epigenetic modifications in a Northern European family population.BMC Med Genomics. 2013 Mar 19;6:9. doi: 10.1186/1755-8794-6-9. BMC Med Genomics. 2013. PMID: 23510163 Free PMC article.
-
Association of rs662799 variant and APOA5 gene haplotypes with metabolic syndrome and its components: a meta-analysis in North Africa.Biosci Rep. 2020 Aug 28;40(8):BSR20200706. doi: 10.1042/BSR20200706. Biosci Rep. 2020. PMID: 32725151 Free PMC article. Review.
-
Genetics of metabolic syndrome.Rev Endocr Metab Disord. 2014 Dec;15(4):243-52. doi: 10.1007/s11154-014-9293-9. Rev Endocr Metab Disord. 2014. PMID: 25124343 Review.
Cited by
-
Aldo-Keto Reductase 1C1 (AKR1C1) as the First Mutated Gene in a Family with Nonsyndromic Primary Lipedema.Int J Mol Sci. 2020 Aug 29;21(17):6264. doi: 10.3390/ijms21176264. Int J Mol Sci. 2020. PMID: 32872468 Free PMC article.
-
Non-Smoking-Associated Lung Cancer: A distinct Entity in Terms of Tumor Biology, Patient Characteristics and Impact of Hereditary Cancer Predisposition.Cancers (Basel). 2019 Feb 10;11(2):204. doi: 10.3390/cancers11020204. Cancers (Basel). 2019. PMID: 30744199 Free PMC article. Review.
-
[Leukocyte count of puerperal sows].Berl Munch Tierarztl Wochenschr. 1996 Sep;109(9):330-5. Berl Munch Tierarztl Wochenschr. 1996. PMID: 9054332 German.
-
Distinct Associations of BMI and Fatty Acids With DNA Methylation in Fasting and Postprandial States in Men.Front Genet. 2021 May 7;12:665769. doi: 10.3389/fgene.2021.665769. eCollection 2021. Front Genet. 2021. PMID: 34025721 Free PMC article.
-
Genetic and clinical factors associated with obesity among adult survivors of childhood cancer: A report from the St. Jude Lifetime Cohort.Cancer. 2015 Jul 1;121(13):2262-70. doi: 10.1002/cncr.29153. Epub 2015 May 11. Cancer. 2015. PMID: 25963547 Free PMC article.
References
-
- Pajvani UB, Hawkins M, Combs TP, Rajala MW, Doebber T, Berger JP, Wagner JA, Wu M, Knopps A, Xiang AH, Utzschneider KM, Kahn SE, Olefsky JM, Buchanan TA, Scherer PE. Complex distribution, not absolute amount of adiponectin, correlates with thiazolidinedione-mediated improvement in insulin sensitivity. J Biol Chem. 2004;279:12152–12162. - PubMed
Publication types
MeSH terms
Substances
Grants and funding
LinkOut - more resources
Full Text Sources
Other Literature Sources
Medical
Molecular Biology Databases
