

Mitotic rate in melanoma: prognostic value of immunostaining and computer-assisted image analysis
- PMID: 23629443
- PMCID: PMC3654084
- DOI: 10.1097/PAS.0b013e31827e50fa
Mitotic rate in melanoma: prognostic value of immunostaining and computer-assisted image analysis
Abstract
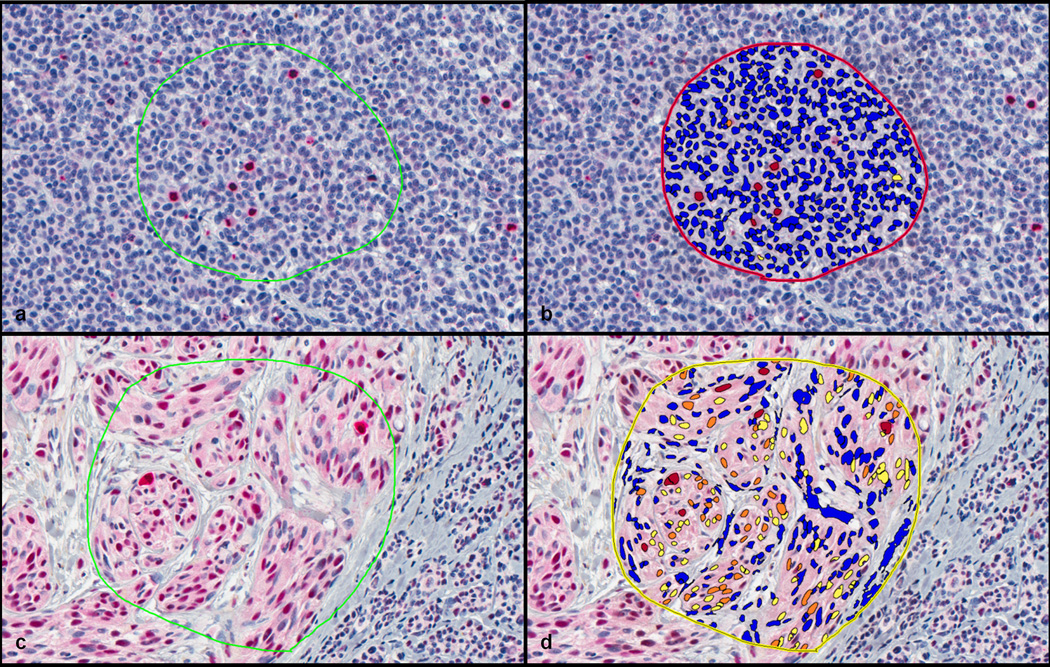
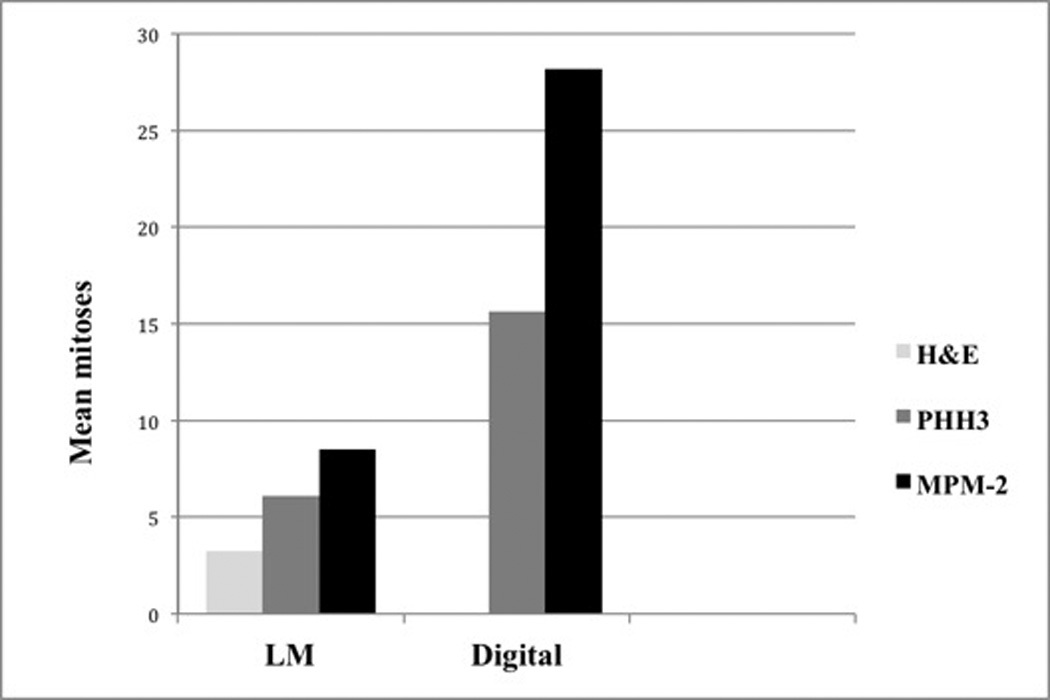
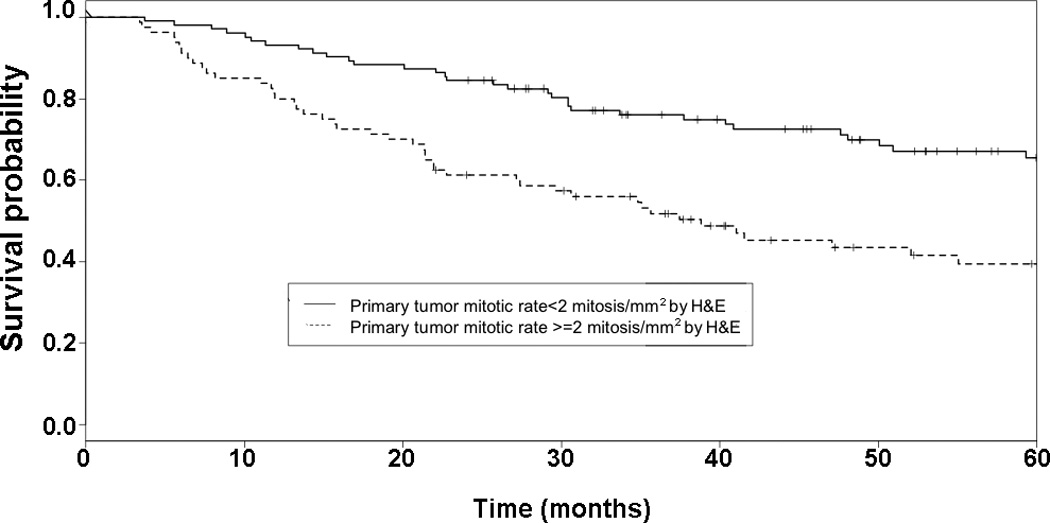
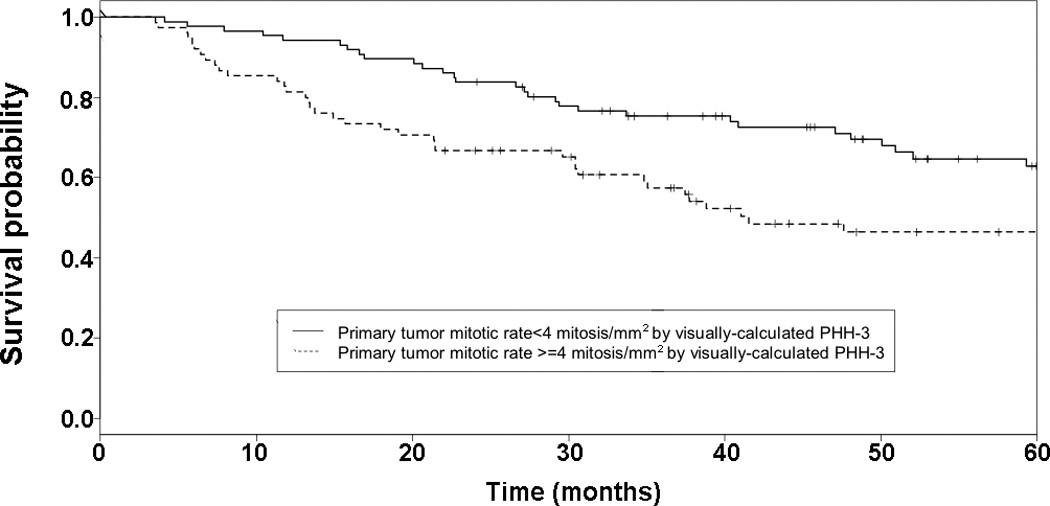
The prognostic value of mitotic rate in melanoma is increasingly recognized, particularly in thin melanoma in which the presence or absence of a single mitosis/mm can change staging from T1a to T1b. Still, accurate mitotic rate calculation (mitoses/mm) on hematoxylin and eosin (H&E)-stained sections can be challenging. Antimonoclonal mitotic protein-2 (MPM-2) and antiphosphohistone-H3 (PHH3) are 2 antibodies reported to be more mitosis-specific than other markers of proliferation such as Ki-67. We used light microscopy and computer-assisted image analysis software to quantify MPM-2 and PHH3 staining in melanoma. We then compared mitotic rates by each method with conventional H&E-based mitotic rate for correlation with clinical outcomes. Our study included primary tissues from 190 nonconsecutive cutaneous melanoma patients who were prospectively enrolled at New York University Langone Medical Center with information on age, gender, and primary tumor characteristics. The mitotic rate was quantified manually by light microscopy of corresponding H&E-stained, MPM-2-stained, and PHH3-stained sections. Computer-assisted image analysis was then used to quantify immunolabeled mitoses on the previously examined PHH3 and MPM-2 slides. We then analyzed the association between mitotic rate and both progression-free and melanoma-specific survival. Univariate analysis of PHH3 found significant correlation between increased PHH3 mitotic rate and decreased progression-free survival (P=0.04). Computer-assisted image analysis enhanced the correlation of PHH3 mitotic rate with progression-free survival (P=0.02). Regardless of the detection method, neither MPM-2 nor PHH3 offered significant advantage over conventional H&E determination of mitotic rate.
Figures
Similar articles
-
Ki-67 expression is superior to mitotic count and novel proliferation markers PHH3, MCM4 and mitosin as a prognostic factor in thick cutaneous melanoma.BMC Cancer. 2010 Apr 14;10:140. doi: 10.1186/1471-2407-10-140. BMC Cancer. 2010. PMID: 20398247 Free PMC article.
-
Prognostic importance of the mitotic marker phosphohistone H3 in cutaneous nodular melanoma.J Invest Dermatol. 2012 Apr;132(4):1247-52. doi: 10.1038/jid.2011.464. Epub 2012 Feb 2. J Invest Dermatol. 2012. PMID: 22297638
-
Improving mitotic cell counting accuracy and efficiency using phosphohistone-H3 (PHH3) antibody counterstained with haematoxylin and eosin as part of breast cancer grading.Histopathology. 2023 Feb;82(3):393-406. doi: 10.1111/his.14837. Epub 2022 Nov 18. Histopathology. 2023. PMID: 36349500 Free PMC article.
-
Useof anti-phosphohistone H3 immunohistochemistry to determine mitotic rate in thin melanoma.Am J Dermatopathol. 2010 Oct;32(7):650-4. doi: 10.1097/DAD.0b013e3181cf7cc1. Am J Dermatopathol. 2010. PMID: 20559123
-
Sentinel node biopsy should be offered in thin melanoma with mitotic rate greater than one.Dermatol Surg. 2011 Aug;37(8):1080-8. doi: 10.1111/j.1524-4725.2011.02015.x. Epub 2011 Jun 2. Dermatol Surg. 2011. PMID: 21635622 Review.
Cited by
-
Development of an Image Analysis-Based Prognosis Score Using Google's Teachable Machine in Melanoma.Cancers (Basel). 2022 Apr 29;14(9):2243. doi: 10.3390/cancers14092243. Cancers (Basel). 2022. PMID: 35565371 Free PMC article.
-
Immune profiling of pituitary tumors reveals variations in immune infiltration and checkpoint molecule expression.Pituitary. 2021 Jun;24(3):359-373. doi: 10.1007/s11102-020-01114-3. Epub 2021 Jan 25. Pituitary. 2021. PMID: 33492612
-
Computer-assisted measurement of primary tumor area is prognostic of recurrence-free survival in stage IB melanoma patients.Mod Pathol. 2017 Oct;30(10):1402-1410. doi: 10.1038/modpathol.2017.64. Epub 2017 Jul 21. Mod Pathol. 2017. PMID: 28731044 Free PMC article.
-
Better see to better agree: phosphohistone H3 increases interobserver agreement in mitotic count for meningioma grading and imposes new specific thresholds.Neuro Oncol. 2015 May;17(5):663-9. doi: 10.1093/neuonc/nov002. Epub 2015 Feb 1. Neuro Oncol. 2015. PMID: 25646026 Free PMC article.
-
Relapse patterns in patients with local and regional cutaneous melanoma.Clin Transl Oncol. 2019 Apr;21(4):412-419. doi: 10.1007/s12094-018-1938-9. Epub 2018 Sep 4. Clin Transl Oncol. 2019. PMID: 30182208
References
-
- Badalamenti G, Rodolico V, Fulfaro F, et al. Gastrointestinal stromal tumors (GISTs): focus on histopathological diagnosis and biomolecular features. Ann Oncol. 2007;18(Suppl 6):vi136–vi140. - PubMed
-
- Baak JP, van Diest PJ, Voorhorst FJ, et al. Prospective multicenter validation of the independent prognostic value of the mitotic activity index in lymph node-negative breast cancer patients younger than 55 years. J Clin Oncol. 2005;23(25):5993–6001. - PubMed
-
- Layfield LJ, Liu K, Dodge R, Barsky SH. Uterine smooth muscle tumors: utility of classification by proliferation, ploidy, and prognostic markers versus traditional histopathology. Arch Pathol Lab Med. 2000;124(2):221–227. - PubMed
-
- Azzola MF, Shaw HM, Thompson JF, et al. Tumor mitotic rate is a more powerful prognostic indicator than ulceration in patients with primary cutaneous melanoma: an analysis of 3661 patients from a single center. Cancer. 2003;97(6):1488–1498. - PubMed
Publication types
MeSH terms
Substances
Grants and funding
LinkOut - more resources
Full Text Sources
Other Literature Sources
Medical
