. 2013 Jul 1;591(13):3401-19.
doi: 10.1113/jphysiol.2013.253062. Epub 2013 Apr 29.

Neurometric amplitude-modulation detection threshold in the guinea-pig ventral cochlear nucleus

Affiliations

Neurometric amplitude-modulation detection threshold in the guinea-pig ventral cochlear nucleus

Mark Sayles et al. J Physiol. .

Abstract

Amplitude modulation (AM) is a pervasive feature of natural sounds. Neural detection and processing of modulation cues is behaviourally important across species. Although most ecologically relevant sounds are not fully modulated, physiological studies have usually concentrated on fully modulated (100% modulation depth) signals. Psychoacoustic experiments mainly operate at low modulation depths, around detection threshold (∼5% AM). We presented sinusoidal amplitude-modulated tones, systematically varying modulation depth between zero and 100%, at a range of modulation frequencies, to anaesthetised guinea-pigs while recording spikes from neurons in the ventral cochlear nucleus (VCN). The cochlear nucleus is the site of the first synapse in the central auditory system. At this locus significant signal processing occurs with respect to representation of AM signals. Spike trains were analysed in terms of the vector strength of spike synchrony to the amplitude envelope. Neurons showed either low-pass or band-pass temporal modulation transfer functions, with the proportion of band-pass responses increasing with increasing sound level. The proportion of units showing a band-pass response varies with unit type: sustained chopper (CS) > transient chopper (CT) > primary-like (PL). Spike synchrony increased with increasing modulation depth. At the lowest modulation depth (6%), significant spike synchrony was only observed near to the unit's best modulation frequency for all unit types tested. Modulation tuning therefore became sharper with decreasing modulation depth. AM detection threshold was calculated for each individual unit as a function of modulation frequency. Chopper units have significantly better AM detection thresholds than do primary-like units. AM detection threshold is significantly worse at 40 dB vs. 10 dB above pure-tone spike rate threshold. Mean modulation detection thresholds for sounds 10 dB above pure-tone spike rate threshold at best modulation frequency are (95% CI) 11.6% (10.0-13.1) for PL units, 9.8% (8.2-11.5) for CT units, and 10.8% (8.4-13.2) for CS units. The most sensitive guinea-pig VCN single unit AM detection thresholds are similar to human psychophysical performance (∼3% AM), while the mean neurometric thresholds approach whole animal behavioural performance (∼10% AM).


Figures
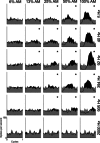
Figure 1
Figure 1. Period histograms as a function of modulation frequency and modulation depth for a single unit
The period histograms are most modulated at high modulation depths. The lowest modulation depth at which significant modulation of the response occurs (*) varies with modulation frequency. At low- and high-modulation frequencies the response is less modulated than at the best modulation frequency (92 Hz). Primary-like unit, BF = 7.87 kHz, BMF = 92 Hz. Data shown were recorded in response to signals presented at 10 dB above pure-tone threshold. Grey shaded area indicates the response to an unmodulated pure tone. Black shaded area and think black line indicates the response to the modulated tone. Modulation depth is indicated at the top of each column. Modulation frequency is indicated to the right of each row. * in the top-right corner of each plot indicates significant phase-locking to the modulation frequency (P < 0.001, Rayleigh statistic > 13.8). Binwidth = 0.05 cycles.
Figure 2
Figure 2. Temporal modulation transfer functions as a function of modulation depth (m), sound level, and unit type
The PL unit has low-pass modulation transfer functions. The CT unit becomes more band-pass at the higher sound level. The CS unit is band-pass tuned at both low and high sound levels. Best modulation frequency does not change with modulation depth. Top row, peri-stimulus time histograms in response to 50 ms duration unmodulated BF tones. Middle row, tMTFs at 10 dB above pure-tone threshold. Bottom row, tMTFs at 40 dB above pure-tone threshold. VS, vector strength; fm, modulation frequency.Left column, primary-like unit (BF = 7.87 kHz). Middle column, transient chopper unit (BF = 7.51 kHz). Right column, sustained chopper unit (BF = 8.15 kHz). Modulation depth (m, %) is shown in the key. Filled symbols are significant (P < 0.001, Rayleigh statistic > 13.8), and open symbols are non-significant.
Figure 3
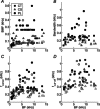
Figure 3. Best modulation frequency (BMF), bandwidth, corner frequency (fcorner), and cut-off frequency (fcut-off) as a function of unit best frequency (BF) for a population of PL, CT, and CS units
Open symbols indicate responses at 10 dB above pure-tone threshold, and filled symbols 40 dB above pure-tone threshold. Unit types as indicated in key in A. A, C and D, data from all tMTFs (low-pass and band-pass). B, data from band-pass tMTFs only.
Figure 4
Figure 4. Modulation gain at BMF, as a function of modulation depth (m) and sound level, for a population of PL, CT, and CS units
Gain decreases monotonically with increasing modulation depth and with increasing sound level. Grey lines, single-unit data. Black lines, population mean, calculated from the single-unit data. Top row, 10 dB above pure-tone threshold. Bottom row, 40 dB above pure-tone threshold. Dashed line in each plot indicates zero gain.
Figure 5
Figure 5. Modulation gain as a function of normalised modulation frequency (fm), modulation depth (m) and sound level, for a population of PL, CT, and CS units
Gain increases with decreasing modulation depth (shown in key at top left, %). CT units show the highest gain, followed by CS units, and then PL units. Gain decreases (and becomes negative) with increasing sound level. Top row, at 10 dB above pure-tone rate threshold. Bottom row, at 40 dB above pure-tone threshold. Left column, primary-like (PL) responses. Middle column, transient chopper (CT) responses. Right column, sustained chopper (CS) responses. Dashed line indicates zero response modulation gain relative to the signal modulation. Data are population mean data calculated over significant portions of the tMTF (i.e. where Rayleigh > 13.8, P < 0.001). Error bars indicate 95% confidence intervals around the population mean.
Figure 6
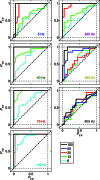
Figure 6. Receiver operating characteristic (ROC) curves for a single unit as a function of modulation depth and modulation frequency at 10 dB above pure-tone threshold
The signal becomes less discriminable from an unmodulated tone with decreasing modulation depth (see key at bottom right), and with both increasing and decreasing modulation frequency relative to best modulation frequency (139 Hz). Responses of a single CT unit (BF = 5.25 kHz), at 10 dB above pure-tone threshold. Probability of true positive (PTP) AM detection plotted against the probability of false positive (PFP) AM detection at 100 equally spaced decision criteria between 0 and the maximum phase-projected vector strength for each modulated–unmodulated signal combination. The modulation frequency corresponding to the modulated signal in each panel is indicated in the lower right-hand corner. The colour code of the text corresponds to values of fm highlighted in Fig. 7. The colour code of the continuous lines corresponds to the modulation depth, as indicated in the figure legend. Diagonal dashed line indicates the expected value if the modulated signal were indistinguishable from an unmodulated tone on the basis of the phase-projected vector strength of spike synchrony at fm.
Figure 7
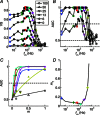
Figure 7. Modulation-detection threshold is calculated as a function of modulation frequency
Logistic fits to the function relating the area under the ROC curve to modulation depth are used to determine the modulation depth at which the single unit response reaches threshold at each individual modulation frequency. The logistic function accurately describes the data. Threshold is lowest around the best modulation frequency, and increases with both increasing and decreasing fm relative to best modulation frequency. Responses of a single CT unit (BF = 5.25 kHz), at 10 dB above pure-tone threshold. A, temporal modulation transfer functions calculated from the vector strength of spike synchrony to the amplitude envelope as a function of fm and m, as indicated in the figure legend. Filled symbols represent significant VS measurements (Rayleigh statistic > 13.8, P < 0.001), open symbols indicate non-significant VS. Colours identify modulation frequencies (5, 40, 75, 139, 260, 485, 905 Hz) at which further analyses are presented in BD. Key shows modulation depth (m, %).;B, area under the receiver operating characteristic curve (AUC) as a function of fm and m. Dashed line at 0.5 indicates the expected value for a signal indistinguishable from an unmodulated signal. Dashed line at 0.75 indicates the value taken as threshold for AM detection. Filled symbols indicate values above threshold, open symbols indicate values below threshold. C, AUC plotted as a function of m for each of the modulation frequencies highlighted in colour in panels A and B. Continuous lines indicate logistic functions fitted to the data. Dashed line at 0.75 indicates threshold. Filled symbols indicate values above threshold, open symbols indicate values below threshold. The m value at which each fitted function crosses this dashed line is taken as the threshold modulation depth (mT) for that fm. D, neural threshold for AM detection plotted as a function of fm calculated from the responses in AC. Colours correspond to the modulation frequencies highlighted in A and B, and fitted with logistic functions in C. For this unit, minimum threshold for AM detection is 3.7% at fm= 139 Hz. At fm= 905 Hz, threshold is not reached at any m.
Figure 8
Figure 8. Population mean receiver operating characteristic curves at the best modulation frequency for PL, CT, and CS units
AM signals become less discriminable from unmodulated tones as modulation depth is decreased, and as sound level is increased. Top row, at 10 dB above pure-tone threshold. Bottom row, at 40 dB above pure-tone threshold. Left column, primary-like (PL) responses. Middle column, transient chopper (CT) responses. Right column, sustained chopper (CS) responses. The probability of a true positive (PTP) AM signal detection is plotted against the probability of a false positive (PFP) detection at each of 100 equally spaced decision criteria between 0 and the maximum phase-projected vector strength (VSpp) for the two signals being compared. The plotted functions are population mean data as a function of m as indicated in the key at top left. Diagonal dashed line indicates chance performance; i.e. the modulated signal is indiscriminable from an unmodulated tone.
Figure 9
Figure 9. Mean area under the receiver operating characteristic curves (AUC) as a function of normalised modulation frequency (fm), modulation depth, and sound level, for a population of PL, CT, and CS units
The area under the ROC curve decreases with decreasing modulation depth and with increasing sound level. This corresponds to a decreasing ability of neurons to discriminate between modulated and unmodulated signals by means of spike synchrony at fm as modulation depth decreases, and as sound level increases. Colour key as in Fig. 8. Top row, at 10 dB above pure-tone threshold. Bottom row, at 40 dB above pure-tone threshold. Left column, primary-like (PL) responses. Middle column, transient chopper (CT) responses. Right column, sustained chopper (CS) responses. Dashed line at AUC = 0.5 indicates chance performance. Dashed line at AUC = 0.75 indicates threshold for AM detection (i.e. AUC significantly different from 0.5). Error bars indicate 95% confidence intervals around the population mean.
Figure 10
Figure 10. Population mean amplitude-modulation detection threshold (mT) as a function of normalised modulation frequency (fm) and sound level for PL, CT and CS units
Threshold is lowest (i.e. best) around best modulation frequency (i.e. at normalised fm= 0). Threshold worsens (i.e. increases) with both increasing and decreasing fm relative to best modulation frequency, and with increasing sound level. The effect of sound level is greater for PL units than for CT or CS units. Left column, primary-like (PL) responses. Middle column, transient chopper (CT) responses. Right column, sustained chopper (CS) responses. Black lines, 10 dB above pure-tone threshold. Grey lines, 40 dB above pure-tone threshold. Error bars indicate 95% confidence intervals around the population mean.

Similar articles

Cited by

References

    1. Bizley JK, Walker KM, King AJ, Schnupp JW. Neural ensemble codes for stimulus periodicity in auditory cortex. J Neurosci. 2010;30:5078–5091. - PMC - PubMed
    1. Blackburn CC, Sachs MB. Classification of unit types in the anteroventral cochlear nucleus: PST histograms and regularity analysis. J Neurophysiol. 1989;62:1303–1329. - PubMed
    1. Borina F, Firzlaff U, Schuller G, Wiegrebe L. Representation of echo roughness and its relationship to amplitude-modulation processing in the bat auditory midbrain. Eur J Neurosci. 2008;27:2724–2732. - PubMed
    1. Bregman AS. Auditory Scene Analysis. Cambridge, MA, USA: MIT Press; 1990.
    1. Burns EM, Viemeister N. Nonspectral pitch. J Acoust Soc Am. 1976;60:863–869.

Publication types

LinkOut - more resources