

Complete artificial saliva alters expression of proinflammatory cytokines in human dermal fibroblasts
- PMID: 23629517
- PMCID: PMC3693133
- DOI: 10.1093/toxsci/kft103
Complete artificial saliva alters expression of proinflammatory cytokines in human dermal fibroblasts
Abstract
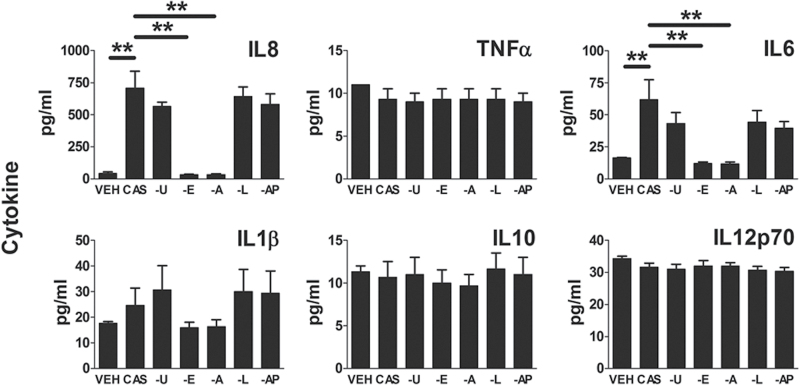
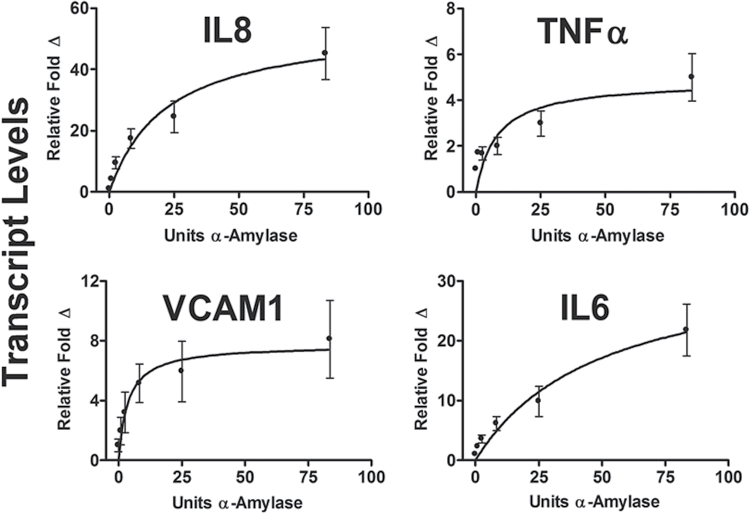
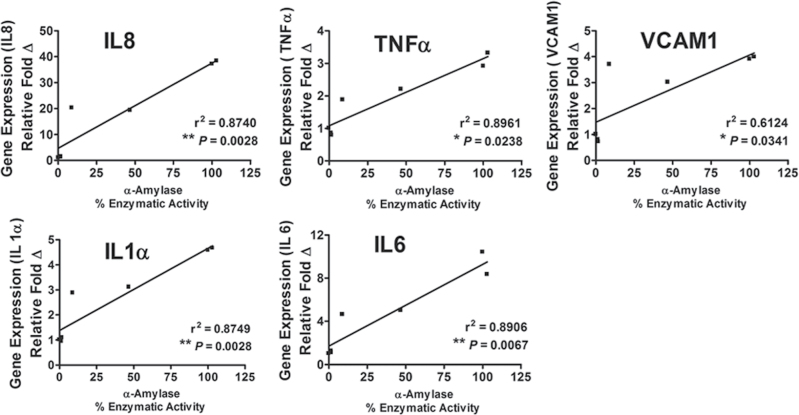
Complete artificial saliva (CAS) is a saliva substitute often used as a vehicle for test articles, including smokeless tobacco products. In the course of a study employing normal adult human dermal fibroblasts (HDFa) as a model in vitro, we discovered that CAS as a vehicle introduced a significant change in the expression of proinflammatory cytokines. To determine the effects of CAS on gene expression, real-time quantitative reverse-transcriptase PCR gene array analysis was used. Results indicate that robust changes in the expression of the proinflammatory cytokine interleukin 8 (IL8) and the vascular cell adhesion molecule 1 (VCAM1) occur within 5h of exposure to CAS. To determine whether CAS also alters cytokine release into the culture media, cytometric bead array assays for human inflammatory cytokines were performed. Analysis shows that CAS induced the release of IL8 and IL6. This study focused on determining which components in CAS were responsible for the proinflammatory response in HDFa. The following components were investigated: α-amylase, lysozyme, acid phosphatase, and urea. Results demonstrated that enzymatically active α-amylase induced gene expression for proinflammatory cytokines IL8, IL6, tumor necrosis factor-α, and IL1α and for VCAM1. Therefore, it is important to carefully evaluate the "vehicle effects" of CAS and its components in in vitro toxicology research.
Keywords: human dermal fibroblasts; interleukin 8; tumor necrosis factor-α; vascular adhesion molecule 1; α-amylase..
Figures


Similar articles
-
Regulation of gene expression by tobacco product preparations in cultured human dermal fibroblasts.Toxicol Appl Pharmacol. 2014 Sep 1;279(2):211-9. doi: 10.1016/j.taap.2014.06.001. Epub 2014 Jun 10. Toxicol Appl Pharmacol. 2014. PMID: 24927667 Free PMC article.
-
Proinflammatory effects of diesel exhaust nanoparticles on scleroderma skin cells.J Immunol Res. 2014;2014:138751. doi: 10.1155/2014/138751. Epub 2014 Jun 1. J Immunol Res. 2014. PMID: 24982919 Free PMC article.
-
IL-11, IL-1α, IL-6, and TNF-α are induced by solar radiation in vitro and may be involved in facial subcutaneous fat loss in vivo.J Dermatol Sci. 2013 Jul;71(1):58-66. doi: 10.1016/j.jdermsci.2013.03.009. Epub 2013 Apr 10. J Dermatol Sci. 2013. PMID: 23639700
-
Interleukin-1alpha stimulates proinflammatory cytokine expression in human cardiac myofibroblasts.Am J Physiol Heart Circ Physiol. 2009 Sep;297(3):H1117-27. doi: 10.1152/ajpheart.00372.2009. Epub 2009 Jul 31. Am J Physiol Heart Circ Physiol. 2009. PMID: 19648252
-
A20, an essential component of the ubiquitin-editing protein complex, is a negative regulator of inflammation in human myometrium and foetal membranes.Mol Hum Reprod. 2017 Sep 1;23(9):628-645. doi: 10.1093/molehr/gax041. Mol Hum Reprod. 2017. PMID: 28911210
Cited by
-
Regulation of gene expression by tobacco product preparations in cultured human dermal fibroblasts.Toxicol Appl Pharmacol. 2014 Sep 1;279(2):211-9. doi: 10.1016/j.taap.2014.06.001. Epub 2014 Jun 10. Toxicol Appl Pharmacol. 2014. PMID: 24927667 Free PMC article.
-
Oral nicotine pouches with an aftertaste? Part 2: in vitro toxicity in human gingival fibroblasts.Arch Toxicol. 2023 Sep;97(9):2343-2356. doi: 10.1007/s00204-023-03554-9. Epub 2023 Jul 23. Arch Toxicol. 2023. PMID: 37482550 Free PMC article.
-
Protective Effect of Strawberry Extract against Inflammatory Stress Induced in Human Dermal Fibroblasts.Molecules. 2017 Jan 21;22(1):164. doi: 10.3390/molecules22010164. Molecules. 2017. PMID: 28117711 Free PMC article.
-
Salivary pellets induce a pro-inflammatory response involving the TLR4-NF-kB pathway in gingival fibroblasts.BMC Oral Health. 2016 Jul 8;17(1):15. doi: 10.1186/s12903-016-0229-5. BMC Oral Health. 2016. PMID: 27430277 Free PMC article.
-
Bidirectional Relationship Between Reduced Blood pH and Acute Pancreatitis: A Translational Study of Their Noxious Combination.Front Physiol. 2018 Oct 1;9:1360. doi: 10.3389/fphys.2018.01360. eCollection 2018. Front Physiol. 2018. PMID: 30327613 Free PMC article.
References
-
- Boxman I. L., Ruwhof C., Boerman O. C., Löwik C. W., Ponec M. (1996). Role of fibroblasts in the regulation of proinflammatory interleukin IL-1, IL-6 and IL-8 levels induced by keratinocyte-derived IL-1. Arch. Dermatol. Res. 288, 391–398 - PubMed
-
- Carlos T. M., Harlan J. M. (1994). Leukocyte-endothelial adhesion molecules. Blood 84, 2068–2101 - PubMed
Publication types
MeSH terms
Substances
Grants and funding
LinkOut - more resources
Full Text Sources
Other Literature Sources
Miscellaneous
