. 2013 Jul;57(7):3230-9.
doi: 10.1128/AAC.00243-13. Epub 2013 Apr 29.

Dormancy is not necessary or sufficient for bacterial persistence

Affiliations

Dormancy is not necessary or sufficient for bacterial persistence

Mehmet A Orman et al. Antimicrob Agents Chemother. 2013 Jul.

Abstract

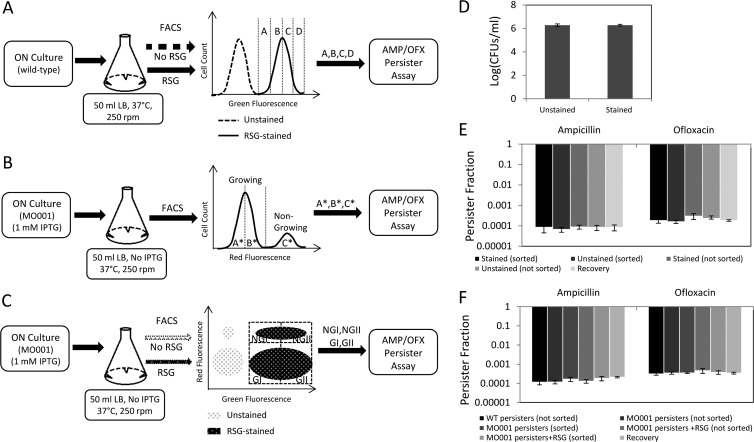
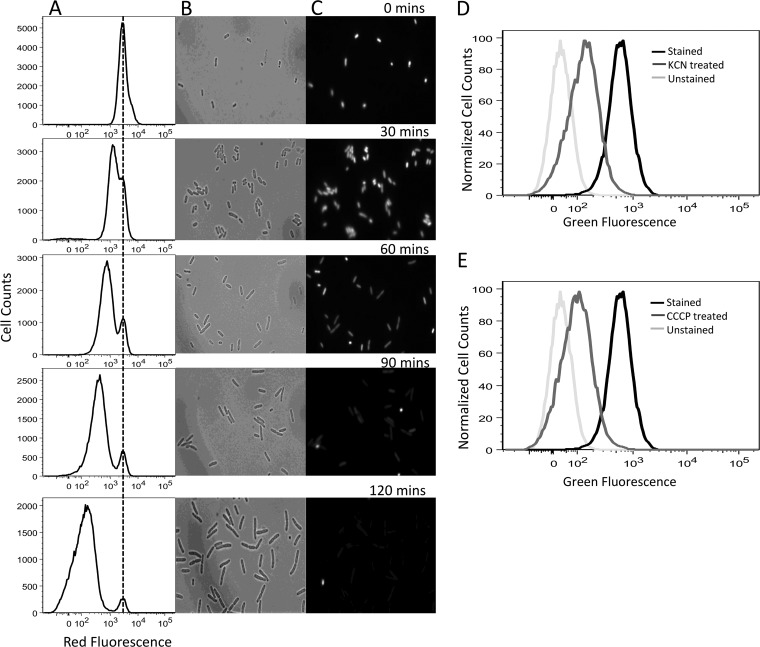
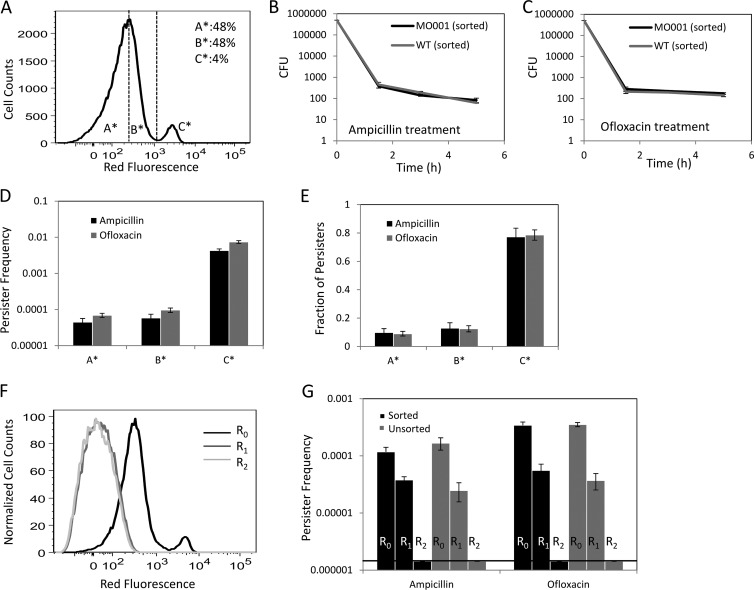
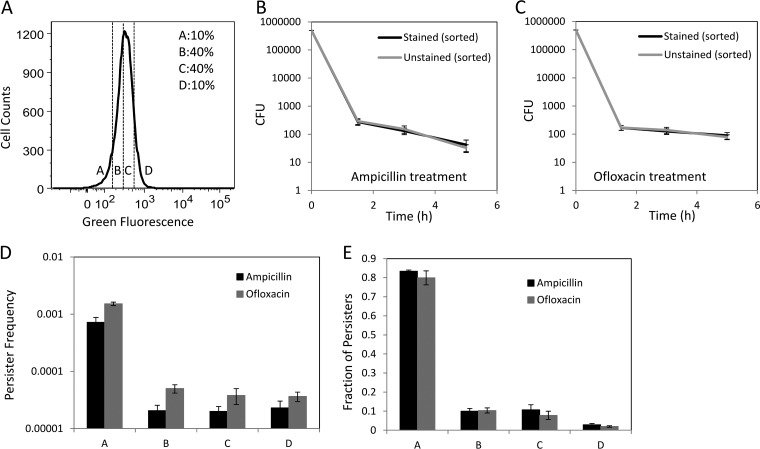
The antibiotic tolerances of bacterial persisters have been attributed to transient dormancy. While persisters have been observed to be growth inhibited prior to antibiotic exposure, we sought to determine whether such a trait was essential to the phenotype. Furthermore, we sought to provide direct experimental evidence of the persister metabolic state so as to determine whether the common assumption of metabolic inactivity was valid. Using fluorescence-activated cell sorting (FACS), a fluorescent indicator of cell division, a fluorescent measure of metabolic activity, and persistence assays, we found that bacteria that are rapidly growing prior to antibiotic exposure can give rise to persisters and that a lack of replication or low metabolic activity prior to antibiotic treatment simply increases the likelihood that a cell is a persister. Interestingly, a lack of significant growth or metabolic activity does not guarantee persistence, as the majority of even "dormant" subpopulations (>99%) were not persisters. These data suggest that persistence is far more complex than dormancy and point to additional characteristics needed to define the persister phenotype.


Figures

Fig 1
Fig 1
FACS methods and control experiments. (A to C) Exponential-phase cells were sorted from the indicated regions (gates) in order to quantify the metabolic and cell division distributions of persisters. Gates were determined by using a fluorescent measure of metabolic activity (RSG) (A), a cell division reporter (mCherry with an IPTG-inducible promoter) (B), or both (C). ON, overnight. (D) RSG staining did not affect cell viability (P = 0.94 by the t test). (E) RSG staining, cell sorting, and segregation did not change the persister levels of exponential-phase E. coli cultures sorted as illustrated in panel A (P = 0.97 for the ampicillin group and P = 0.52 for the ofloxacin group, using ANOVA). (F) RSG staining, cell sorting, and segregation did not alter persister levels of mCherry-expressing cells sorted as in panel C (P = 0.31 for the ampicillin group and P = 0.75 for the ofloxacin group, using ANOVA). Recovery is the calculated frequency of persisters in the total population, based on the persister frequencies measured from the segregated quantiles (see Materials and Methods).
Fig 2
Fig 2
Cell division and metabolic activity reporters. Division at the single-cell level was monitored by flow cytometry and microscopy. After accumulation of mCherry protein during overnight culture, cells were washed to remove the inducer and inoculated into fresh medium without inducer. When the cells started to divide, the red fluorescence of the population decreased, except for a small subpopulation whose fluorescence remained constant (nongrowing cells). Panel A shows the flow cytometry data, whereas panels B and C show phase-contrast and fluorescence images taken by microscopy, respectively, at the indicated time points during exponential-phase growth. (D and E) Cellular metabolic activity was characterized by RSG staining. RSG produces a stable green fluorescence signal when reduced by bacterial reductases. The fluorescence signals were reduced when the cells were treated with KCN and CCCP, which block respiration and deplete the proton motive force, respectively.
Fig 3
Fig 3
Cell division properties of persisters. (A) The regions to be sorted (A*, B*, and C*) were determined based on the proliferation rates of exponential-phase cells. A* and B* comprised approximately 96% of the population (48% each), whereas C* contained approximately 4% of all cells. (B and C) CFU were counted at the indicated time points during the ampicillin or ofloxacin treatment of FACS-sorted or nonsorted cells. MO001 had statistically indistinguishable persister levels compared to the wild type (P = 0.38 for ampicillin persisters at the 5-h time point and 0.30 for ofloxacin persisters at the 5-h time point, by the t test). (D and E) Persister frequencies and fractions of A*, B*, and C* were determined 5 h after antibiotic treatment. The frequency is the ratio of persisters to the initial number of FACS-sorted cells. The fraction of persisters of a region such as A* is the ratio of persisters in A* to the total number of persisters in the culture. (F) Repeated inoculation into fresh medium eliminated the nongrowing subpopulation. Overnight cultures of cells with mCherry protein were inoculated (1:1,000) into fresh medium without inducer and cultured until the OD600 reached 0.1. The cells were then diluted 1:50 in fresh medium and cultured identically until the OD600 again reached 0.1, and this cycle was repeated twice, resulting in three rounds in total (R0, R1, and R2). (G) At the end of each round, cells were sorted by FACS to determine the persister levels. No significant differences were observed between bench-top- and FACS-sorted samples (P = 0.37 for R0-ampicillin samples, 0.88 for R0-ofloxacin samples, 0.30 for R1-ampicillin samples, and 0.42 for R1-ofloxacin samples, using the t test). Note that P values for R2 samples could not be determined because the number of persisters was found to be under the limit of detection for these samples.
Fig 4
Fig 4
Metabolic activity of persisters. (B and C) CFU were determined at the indicated time points during the antibiotic treatment. RSG staining did not affect the persister levels (P = 0.58 for ampicillin persisters at the 5-h time point and 0.52 for ofloxacin persisters at the 5-h time point, using the t test). Persister frequencies (D) as well as fractions (E) were quantified after 5 h of antibiotic treatment of FACS-sorted cells from regions A, B, C, and D, based on RSG staining (A).
Fig 5
Fig 5
2D FACS sorting. (A) Unstained exponential-phase MO001 cells. (B) RSG-stained MO001 cells. (C and D) CFU were determined at the indicated time points during the antibiotic treatment. Persister frequencies (E) as well as fractions (F) were quantified after 5 h of antibiotic treatment of FACS-sorted cells from the NGI, NGII, GI, and GII regions (B). There was no significant difference in persister frequencies between NGI and NGII (P = 0.77 for ampicillin samples and P = 0.09 for ofloxacin samples, using the t test) or between GI and GII (P = 0.45 for ampicillin samples and P = 0.86 for ofloxacin samples, using the t test).

References

    1. Spoering AL, Lewis K. 2001. Biofilms and planktonic cells of Pseudomonas aeruginosa have similar resistance to killing by antimicrobials. J. Bacteriol. 183:6746–6751 - PMC - PubMed
    1. Lewis K. 2010. Persister cells. Annu. Rev. Microbiol. 64:357–372 - PubMed
    1. Balaban NQ, Merrin J, Chait R, Kowalik L, Leibler S. 2004. Bacterial persistence as a phenotypic switch. Science 305:1622–1625 - PubMed
    1. Keren I, Shah D, Spoering A, Kaldalu N, Lewis K. 2004. Specialized persister cells and the mechanism of multidrug tolerance in Escherichia coli. J. Bacteriol. 186:8172–8180 - PMC - PubMed
    1. Shah D, Zhang ZG, Khodursky A, Kaldalu N, Kurg K, Lewis K. 2006. Persisters: a distinct physiological state of E. coli. BMC Microbiol. 6:53. 10.1186/1471-2180-6-53 - DOI - PMC - PubMed

Publication types

MeSH terms

Substances

LinkOut - more resources