

Temperature variation makes ectotherms more sensitive to climate change
- PMID: 23630036
- PMCID: PMC3908367
- DOI: 10.1111/gcb.12240
Temperature variation makes ectotherms more sensitive to climate change
Abstract
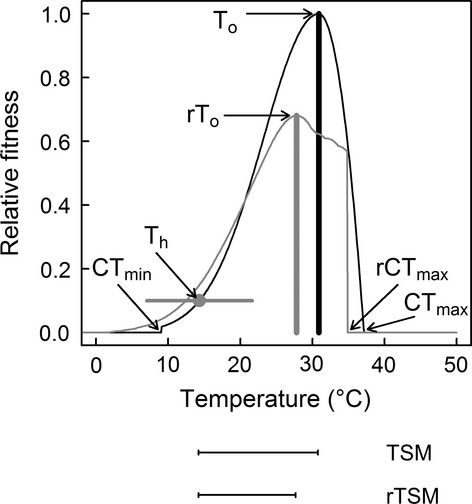
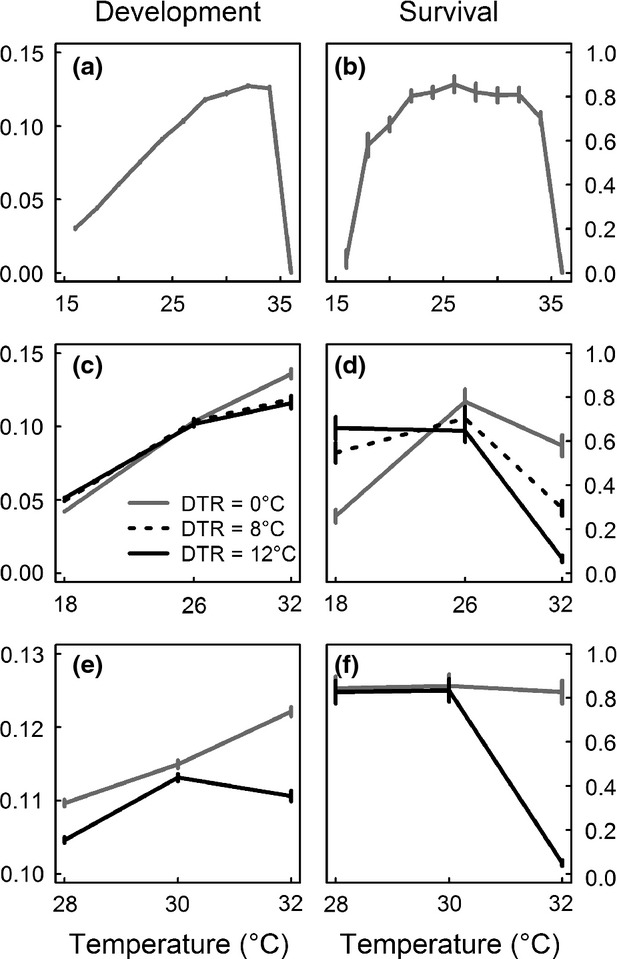
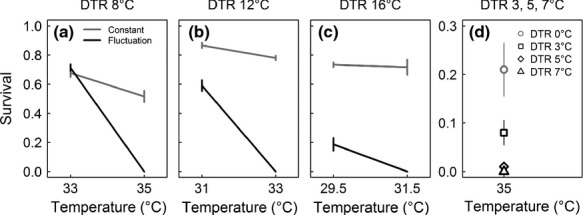
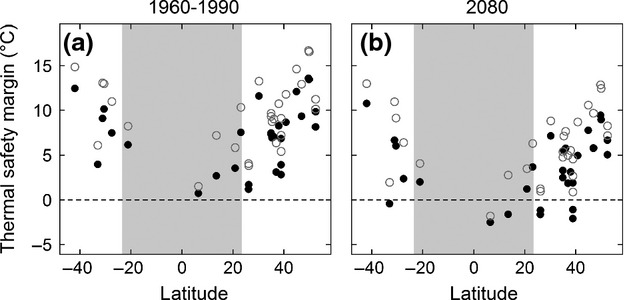
Ectotherms are considered to be particularly vulnerable to climate warming. Descriptions of habitat temperatures and predicted changes in climate usually consider mean monthly, seasonal or annual conditions. Ectotherms, however, do not simply experience mean conditions, but are exposed to daily fluctuations in habitat temperatures. Here, we highlight how temperature fluctuation can generate 'realized' thermal reaction (fitness) norms that differ from the 'fundamental' norms derived under standard constant temperatures. Using a mosquito as a model organism, we find that temperature fluctuation reduces rate processes such as development under warm conditions, increases processes under cool conditions, and reduces both the optimum and the critical maximum temperature. Generalizing these effects for a range of terrestrial insects reveals that prevailing daily fluctuations in temperature should alter the sensitivity of species to climate warming by reducing 'thermal safety margins'. Such effects of daily temperature dynamics have generally been ignored in the climate change literature.
Keywords: Anopheles stephensi; Jensen's inequality; climate change; conservation; diurnal temperature fluctuation; ectotherm fitness; thermal fitness curve; thermal reaction norm.
© 2013 The Authors. Global Change Biology published by John Wiley & Sons Ltd.
Figures
References
-
- Amarasekare P, Savage V. A framework for elucidating the temperature dependence of fitness. American Naturalist. 2012;179:178–191. - PubMed
-
- Angert AL, Sheth SN, Paul JR. Incorporating population-level variation in thermal performance into predictions of geographic range shifts. Integrative and Comparative Biology. 2011;51:733–750. - PubMed
-
- Asbury D, Angilletta M. Thermodynamic effects on the evolution of performance curves. American Naturalist. 2010;176:E40–E49. - PubMed
-
- Atkins KE, Travis JMJ. Local adaptation and the evolution of species' ranges under climate change. Journal of Theoretical Biology. 2010;266:449–457. - PubMed
-
- Bayoh MN, Lindsay SW. Effect of temperature on the development of the aquatic stages of Anopheles gambiae sensu stricto (Diptera: Culicidae) Bulletin of Entomological Research. 2003;93:375–381. - PubMed
Publication types
MeSH terms
LinkOut - more resources
Full Text Sources
Other Literature Sources
Medical
