. 2013 Jun 11;110(24):10039-44.
doi: 10.1073/pnas.1215283110. Epub 2013 Apr 29.

Glycolytic strategy as a tradeoff between energy yield and protein cost

Affiliations

Glycolytic strategy as a tradeoff between energy yield and protein cost

Avi Flamholz et al. Proc Natl Acad Sci U S A. .

Abstract

Contrary to the textbook portrayal of glycolysis as a single pathway conserved across all domains of life, not all sugar-consuming organisms use the canonical Embden-Meyerhoff-Parnass (EMP) glycolytic pathway. Prokaryotic glucose metabolism is particularly diverse, including several alternative glycolytic pathways, the most common of which is the Entner-Doudoroff (ED) pathway. The prevalence of the ED pathway is puzzling as it produces only one ATP per glucose--half as much as the EMP pathway. We argue that the diversity of prokaryotic glucose metabolism may reflect a tradeoff between a pathway's energy (ATP) yield and the amount of enzymatic protein required to catalyze pathway flux. We introduce methods for analyzing pathways in terms of thermodynamics and kinetics and show that the ED pathway is expected to require several-fold less enzymatic protein to achieve the same glucose conversion rate as the EMP pathway. Through genomic analysis, we further show that prokaryotes use different glycolytic pathways depending on their energy supply. Specifically, energy-deprived anaerobes overwhelmingly rely upon the higher ATP yield of the EMP pathway, whereas the ED pathway is common among facultative anaerobes and even more common among aerobes. In addition to demonstrating how protein costs can explain the use of alternative metabolic strategies, this study illustrates a direct connection between an organism's environment and the thermodynamic and biochemical properties of the metabolic pathways it employs.

Keywords: enzyme cost; evolution.


Conflict of interest statement

The authors declare no conflict of interest.

Figures

Fig. 1.
Fig. 1.
Structural similarity and energetic differences between the ED and EMP pathways. (A) The ED (purple) and EMP pathways (green) overlap but differ in ATP yield. The EMP pathway hydrolyzes two ATP to phosphorylate glucose twice and recovers four ATP by metabolizing two triose-phosphates through lower glycolysis, yielding two ATP in total. In contrast, the ED pathway invests one ATP in phosphorylation and recovers two (glucose is cleaved into only one fermentable product) yielding one ATP per glucose. (B) A schematic of the ED and EMP pathways assuming that glucose is phosphorylated intracellularly by hexokinase and lactate is the final product. These pathways each contain unique enzymes (marked with *) but also share all of the reactions of lower glycolysis (from G3P through pyruvate). pfk is unique to the glycolytic direction of the EMP pathway, while the edd and eda enzymes are unique to the ED pathway. (C) Ignoring phosphorylation, lower glycolysis and the upper portion of the ED pathway are composed of the same, highly exergonic reaction sequence. Abbreviations: eda, kdpg aldolase; edd, phosphogluconate dehydratase; eno, enolase; fba, fructose bisphosphate aldolase; gapdh, glyceraldehyde 3-phosphate dehydrogenase; hxk, hexokinase; ldh, lactate dehydrogenase; pfk, 6-phosphofructokinase; pgi, phosphoglucose isomerase; pgk, phosphoglycerate kinase; pgl, phosphogluconolactonase; pgm, phosphoglycerate mutase; pyk, pyruvate kinase; tim, triosephosphate isomerase; zwf, glucose 6-phosphate dehydrogenase.
Fig. 2.
Fig. 2.
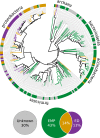
Phylogenetic analysis of the ED and EMP pathways. Organisms are considered to be ED or EMP capable if their genome is annotated as containing the pathway’s unique genes and a pyk (Materials and Methods, SI Text). Closely related organisms were merged to avoid double-counting, and the resulting distribution of pathway capability is shown on a phylogenetic tree of heterotrophic bacteria and archaea (Materials and Methods). Of these microbes, 57% are EMP-capable, while 27% are ED-capable; 14% are genetically capable of both pathways, and we were unable to annotate the remaining 30%. The pathways are largely independent: most organisms were annotated as containing only one pathway (80% of those annotated at all). We identified 10 branching points on the phylogenetic tree where all descendants of one branch uniformly contain the same pathway and the second branch contains descendants with the other pathway. This might suggest that a microbe’s choice of glycolytic pathway is due to some selection process.
Fig. 3.
Fig. 3.
The ED pathway is substantially more thermodynamically favorable than the EMP pathway. The pathway thermodynamic profile is represented as the cumulative sum of the intermediate reaction Gibbs energies (ΔrG) in various conditions. All ΔrG values are transformed to pH 7.5 and ionic strength 0.2 M and are given per mole of the pathway net reaction so that the final sum equals the ΔrG′ of the net reaction. The dashed line represents the profile given 1 mM reactant concentrations (ΔrG′m), and the solid line represents reaction energies when concentrations are optimized to maximize the Net Flux Ratio (Materials and Methods). Optimization was performed presuming metabolite concentrations range between 1 μM and 10 mM. The least favorable reactions are highlighted in yellow. Under optimized concentrations, the least favorable ED reactions (gapdh, pgk, pgm, and eno with ΔrG′ ∼ –6.4 kJ/mol) are nearly twice as exergonic as the least favorable EMP reactions (fba, tim, gapdh, pgk, and gpm with ΔrG′ ∼ –2.9 kJ/mol).
Fig. 4.
Fig. 4.
Protein cost of the ED and EMP pathways. The protein cost of each pathway was calculated as the minimum total enzyme mass per unit pathway flux required for a pathway’s operation (Materials and Methods). All enzymes were initially assumed to be equally fast and high-affinity. Predicted enzyme levels are shown in log-scale so that each multiplicative term in the equation for λE contributes additively. The baseline enzyme investment (ME/kcat) is the minimum enzyme mass required to convert a mole of substrate per second if there is no thermodynamic or kinetic constraints. Due to pathway stoichiometry, some reactions must occur twice for each glucose metabolized. The effect of stoichiometry on λE is shown in red. If the enzyme is not saturated or the reaction is near equilibrium, then the saturation (green) or thermodynamic (blue) terms increase enzyme levels further. Under these assumptions, several EMP enzymes must be expressed at levels five- to sevenfold higher than the theoretical minimum and the pathway as a whole is expected to require 3.5-fold more protein mass than the ED pathway to catalyze the same flux.
Fig. 5.
Fig. 5.
The EMP pathway is expected to occupy 3–7% of the E. coli proteome, three- to fivefold more than the ED. Aerobically grown E. coli consumes ∼5 mmol glucose gDW−1⋅h−1 through the EMP pathway and 50–55% of E. coli dry weight is protein. Transparent gray bars represent the mass fraction of the proteome that would be required in the hypothetical case that all pathway reactions were irreversible and all enzymes could be substrate-saturated. If all enzymes were kinetically identical (as in Fig. 4), then we predict that 3% of E. coli's protein mass would be EMP enzymes. Applying measured kinetic parameters for each enzyme only increases this estimate, predicting that EMP enzymes would occupy 7% of the proteome. This prediction is due to the interplay of thermodynamic and kinetic factors, which prevents several EMP enzymes from being saturated and requires some reactions to operate near equilibrium. The ED pathway, in contrast, can achieve an equivalent steady-state flux with much less enzymatic protein mass because of its more favorable thermodynamic profile.
Fig. 6.
Fig. 6.
Prokaryotic glycolytic strategy correlates with the availability of nonglycolytic energy sources. Each organism was marked as ED-capable, EMP-capable, or capable of both pathways as in Fig. 2 (Materials and Methods). Organisms were further categorized as aerobes, anaerobes, or facultative anaerobes according to the IMG database (38). Closely related organisms were merged (Materials and Methods). The distribution of pathway capabilities is not uniform. Rather, the fraction of organisms capable only of the EMP pathway decreases with increasing exposure to oxygen: 97% of anaerobes are solely capable of the EMP pathway (P < 0.003), while only 55% of aerobes are similarly categorized. Facultative prokaryotes tend to contain the EMP pathway alone (P < 0.001) or genes for both pathways (P < 0.05), while aerobes are highly enriched with the ED pathway (P < 0.001). This trend agrees with our prediction that organisms with significant nonglycolytic sources of ATP (i.e., oxidative phosphorylation) will tend to use the ED pathway due to its lower protein cost.

Comment in

  • The cost of efficiency in energy metabolism.
    Stettner AI, Segrè D. Stettner AI, et al. Proc Natl Acad Sci U S A. 2013 Jun 11;110(24):9629-30. doi: 10.1073/pnas.1307485110. Epub 2013 May 31. Proc Natl Acad Sci U S A. 2013. PMID: 23729810 Free PMC article. No abstract available.

References

    1. Romano AH, Conway T. Evolution of carbohydrate metabolic pathways. Res Microbiol. 1996;147(6-7):448–455. - PubMed
    1. Kim BH, Gadd GM. Bacterial Physiology and Metabolism. Cambridge, UK: Cambridge Univ Press; 2008.
    1. Fraenkel D. Escherichia coli and Salmonella. In: Neidhardt FC, editor. Cellular and Molecular Biology. Vol. 1. Washington, DC: American Society for Microbiology; 1996. pp. 189–199.
    1. Conway T. The Entner-Doudoroff pathway: History, physiology and molecular biology. FEMS Microbiol Rev. 1992;9(1):1–27. - PubMed
    1. Meléndez-Hevia E, Waddell TG, Heinrich R, Montero F. Theoretical approaches to the evolutionary optimization of glycolysis—chemical analysis. Eur J Biochem. 1997;244(2):527–543. - PubMed

Publication types

MeSH terms