. 2013 May 14;110(20):8063-8.
doi: 10.1073/pnas.1301804110. Epub 2013 Apr 29.

Single-molecule DNA repair in live bacteria

Affiliations

Single-molecule DNA repair in live bacteria

Stephan Uphoff et al. Proc Natl Acad Sci U S A. .

Abstract

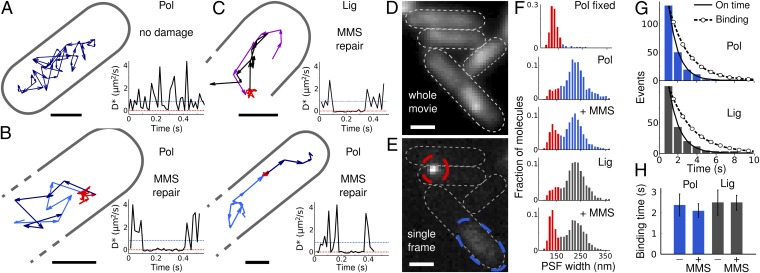
Cellular DNA damage is reversed by balanced repair pathways that avoid accumulation of toxic intermediates. Despite their importance, the organization of DNA repair pathways and the function of repair enzymes in vivo have remained unclear because of the inability to directly observe individual reactions in living cells. Here, we used photoactivation, localization, and tracking in live Escherichia coli to directly visualize single fluorescent labeled DNA polymerase I (Pol) and ligase (Lig) molecules searching for DNA gaps and nicks, performing transient reactions, and releasing their products. Our general approach provides enzymatic rates and copy numbers, substrate-search times, diffusion characteristics, and the spatial distribution of reaction sites, at the single-cell level, all in one measurement. Single repair events last 2.1 s (Pol) and 2.5 s (Lig), respectively. Pol and Lig activities increased fivefold over the basal level within minutes of DNA methylation damage; their rates were limited by upstream base excision repair pathway steps. Pol and Lig spent >80% of their time searching for free substrates, thereby minimizing both the number and lifetime of toxic repair intermediates. We integrated these single-molecule observations to generate a quantitative, systems-level description of a model repair pathway in vivo.

Keywords: DNA damage response; cytosolic diffusion; protein-DNA interaction; single-molecule tracking; super-resolution microscopy.


Conflict of interest statement

The authors declare no conflict of interest.

Figures

Fig. 1.
Fig. 1.
PALM and tracking of DNA-binding proteins in live E. coli. (A) Excision repair pathways leave gapped intermediates to be filled by DNA polymerase and sealed by Lig. (B) Accumulated Pol-PAmCherry fluorescence in a live E. coli cell. (Scale bars, 1 μm.) (C) PSF of a single Pol-PAmCherry molecule at 15-ms exposure. (D) Example tracks of diffusing Pol (blue) and bound Pol (red) on a transmitted light image. (E) All Pol tracks in one cell. (F) Pol tracks label the nucleoid in replicating E. coli. Tracks are shown on transmitted light images with the distribution of localizations across the long cell axis. (Left to Right): short cell with a single chromosome; medium-length cell during chromosome segregation; long cell with two separated chromosomes. (G) MSD versus lag time (± SD) for Fis (green triangles), Lig (black triangles), Pol (blue circles) in live cells, and Pol in fixed cells (red squares). (H) Cumulative distributions of the diffusion step length between consecutive localizations. The distributions shift to longer steps with increasing diffusion coefficient D.
Fig. 2.
Fig. 2.
Direct observation of DNA repair in live E. coli. (A) Distributions of the apparent diffusion coefficient (D*) for Pol and Lig in undamaged cells; Pol in fixed cells; Pol and Lig in live cells under constant 100-mM MMS treatment. n > 2,000 tracks; bound molecule populations are shown in red. (B) Percentage of bound Pol, Lig, and Fis molecules in undamaged cells and with MMS (± SEM; n > 2,000 tracks). (C) D* distributions for Fis in undamaged cells and with 100 mM MMS treatment (n > 10,000 tracks). (D and E) Pol and Lig tracks in undamaged cells (Upper) and with MMS (Lower). Diffusing tracks in blue/gray, bound tracks in red. (Scale bars, 1 μm.)
Fig. 3.
Fig. 3.
Visualizing and timing individual repair events. (A) Single Pol track in an undamaged cell. (Scale bars, 0.5 μm.) Time trace of the corresponding diffusion steps from the displacements between localizations; dotted blue and red lines are the average D* of free and bound Pol, respectively. (B) Two example Pol tracks in MMS damaged cells showing the substrate search path (light blue) that leads to a repair event (red), and continued search (dark blue). Corresponding time traces show D* ∼ 0 μm2·s−1 during repair events. (C) Lig search (magenta), repair (red), and continued diffusion (black), with D* time trace. (D) Accumulated Pol-PAmCherry fluorescence of a whole movie. (Scale bars, 1 μm.) (E) Example frame at 750-ms exposure time with PSFs of bound and diffusing Pol (red and blue outlines). (F) Fitted PSF width in fixed cells, undamaged cells, and with 100-mM MMS at 750-ms exposure time. Bound populations with narrow PSFs are in red. (G) On-time distributions for bound Pol and Lig with exponential fits (solid lines) and photobleaching-corrected binding time distributions (dashed circled lines). (H) Mean Pol and Lig binding times in undamaged cells and with MMS (± SEM; from three exposure and excitation conditions).
Fig. 4.
Fig. 4.
Single-cell analysis shows that Pol (Upper row) and Lig (Lower row) saturate repair substrates. (A) Protein copy number distributions. (B) Distributions of the percentage of bound Pol and Lig across cells in undamaged cells and with 100-mM MMS. (C) Percentages of bound Pol and Lig with MMS as a function of their copy numbers per cell (± SEM). (D) Number of diffusing and bound Pol and Lig with MMS as a function of their copy numbers per cell. Black lines: hypothetical case of unlimited substrates in which the bound percentage was independent of the copy number. (E) MMS dose–response curves show the average percentage of bound Pol and Lig for different MMS concentrations (± SEM; n = 4).
Fig. 5.
Fig. 5.
Timing of the Pol response to DNA damage and recovery and the influence of the adaptive response on Pol repair rates. (A) Percentage of bound Pol (left axis), repair rates per Pol molecule and per cell (right axes), measured over time during constant 100-mM MMS treatment (red) and control (blue). The adaptive response was induced with 3-mM MMS for 1 h before measuring adapted cells under constant 100-mM MMS treatment (magenta) (± SEM; n = 3 for nonadapted cells, n = 5 for adapted cells). (B) Pol DNA-damage response during 100-mM MMS treatment for 15 min, followed by recovery after removing MMS (blue background) (± SEM; n = 3). The integrated Pol repair activity above the basal level is highlighted in orange. (C and D) Pol substrate search times based on data in A and B. (E) Model for Pol and Lig activities in undamaged E. coli, and under saturating MMS damage repair (F).

References

    1. Friedberg EC. DNA Repair and Mutagenesis. Washington, DC: American Society for Microbiology; 2006.
    1. Fu D, Calvo JA, Samson LD. Balancing repair and tolerance of DNA damage caused by alkylating agents. Nat Rev Cancer. 2012;12(2):104–120. - PMC - PubMed
    1. Senejani AG, et al. Y265C DNA polymerase beta knockin mice survive past birth and accumulate base excision repair intermediate substrates. Proc Natl Acad Sci USA. 2012;109(17):6632–6637. - PMC - PubMed
    1. Kuzminov A. Single-strand interruptions in replicating chromosomes cause double-strand breaks. Proc Natl Acad Sci USA. 2001;98(15):8241–8246. - PMC - PubMed
    1. Elowitz MB, Levine AJ, Siggia ED, Swain PS. Stochastic gene expression in a single cell. Science. 2002;297(5584):1183–1186. - PubMed

Publication types

Substances