. 2013 May 14;110(20):8248-53.
doi: 10.1073/pnas.1221214110. Epub 2013 Apr 29.

Intermediate intrinsic diversity enhances neural population coding

Affiliations

Intermediate intrinsic diversity enhances neural population coding

Shreejoy J Tripathy et al. Proc Natl Acad Sci U S A. .

Abstract

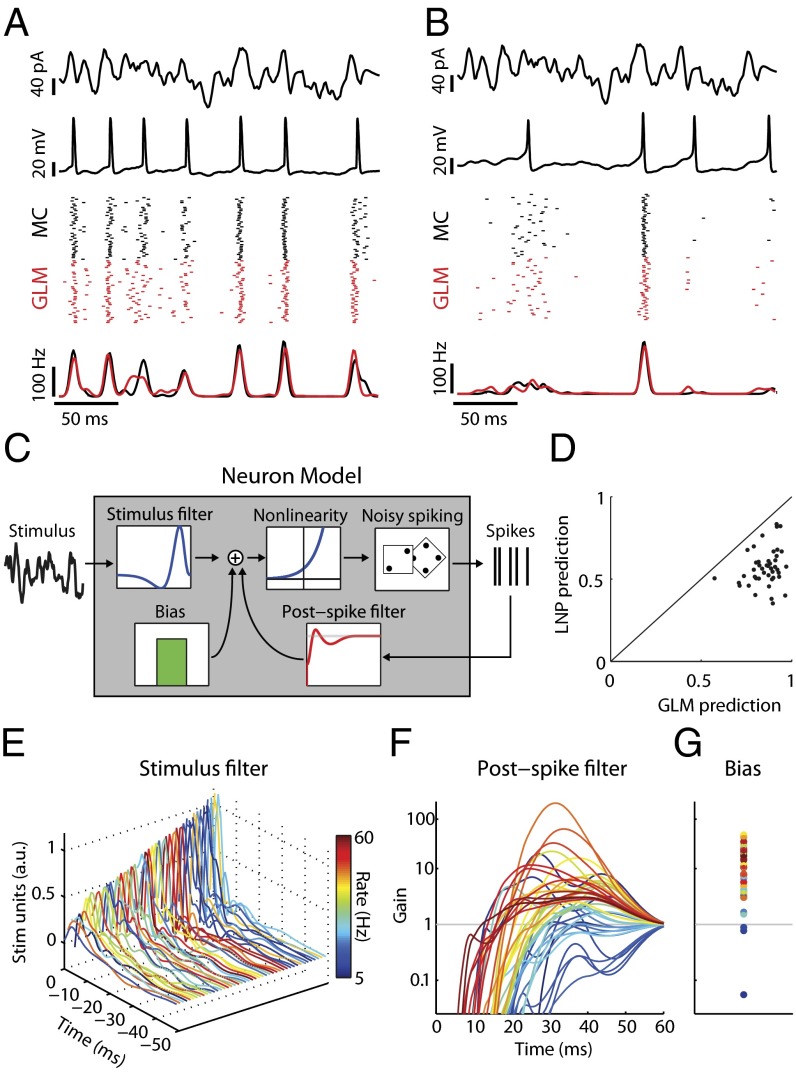
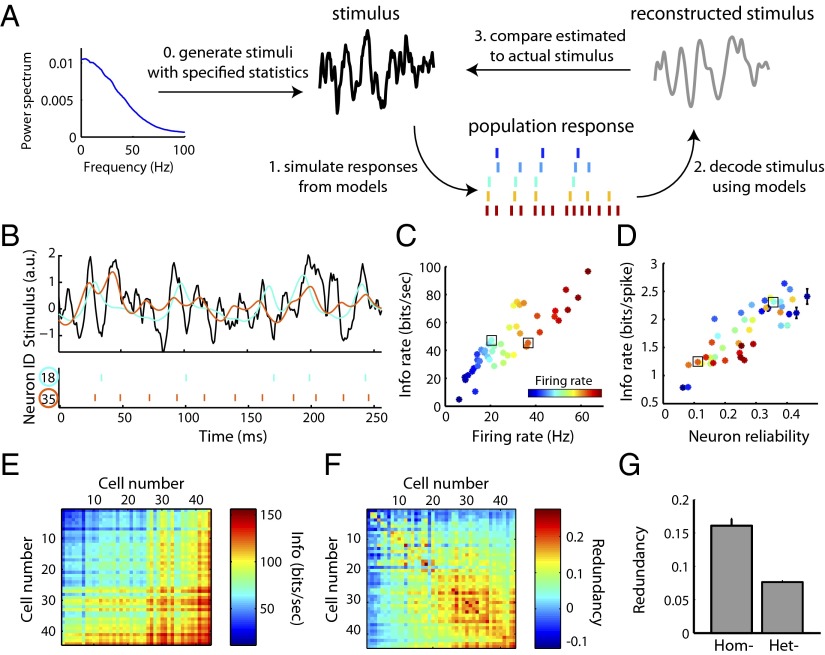
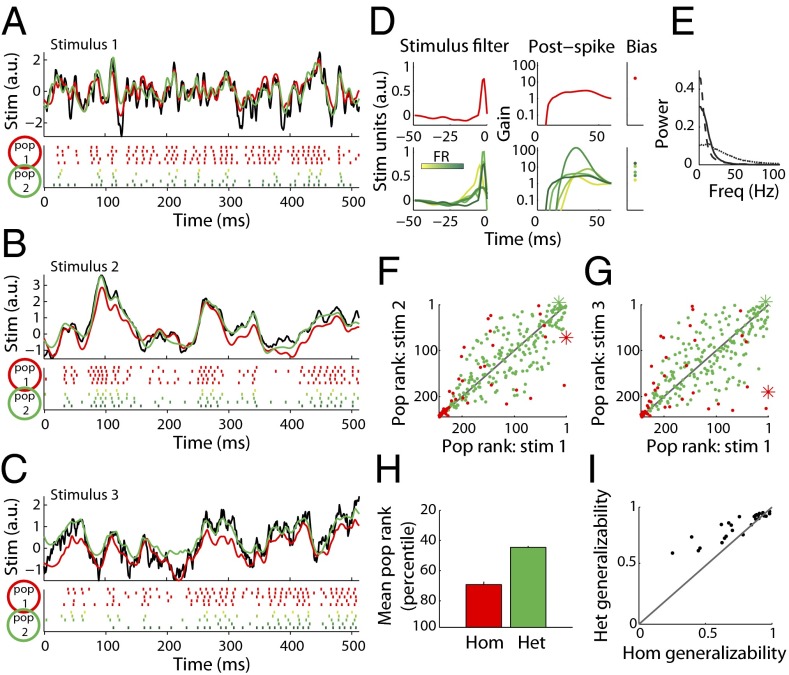
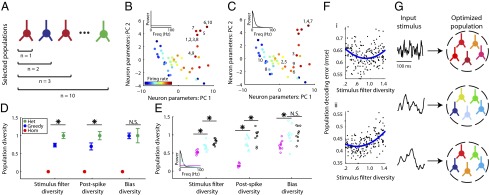
Cell-to-cell variability in molecular, genetic, and physiological features is increasingly recognized as a critical feature of complex biological systems, including the brain. Although such variability has potential advantages in robustness and reliability, how and why biological circuits assemble heterogeneous cells into functional groups is poorly understood. Here, we develop analytic approaches toward answering how neuron-level variation in intrinsic biophysical properties of olfactory bulb mitral cells influences population coding of fluctuating stimuli. We capture the intrinsic diversity of recorded populations of neurons through a statistical approach based on generalized linear models. These models are flexible enough to predict the diverse responses of individual neurons yet provide a common reference frame for comparing one neuron to the next. We then use Bayesian stimulus decoding to ask how effectively different populations of mitral cells, varying in their diversity, encode a common stimulus. We show that a key advantage provided by physiological levels of intrinsic diversity is more efficient and more robust encoding of stimuli by the population as a whole. However, we find that the populations that best encode stimulus features are not simply the most heterogeneous, but those that balance diversity with the benefits of neural similarity.

Keywords: generalized linear models; intrinsic biophysics; ion channels; neural variability; stimulus coding.


Conflict of interest statement

The authors declare no conflict of interest.

Figures

Fig. 1.
Fig. 1.
Simple models capture mitral cell stimulus-evoked responses and intrinsic diversity. (A) MC intrinsic properties are probed using filtered broadband stimuli (first row) injected somatically to evoke changes in membrane voltage (second row). Spike rasters (third row; black) and peri-stimulus time histograms (PSTH) (fourth row; black) for repeated stimulus presentations (n = 40 trials) show that this MC spikes to the stimulus with temporal jitter and displays a coarse stimulus preference. Model neuron rasters (Third Row, red) and PSTH (fourth row, red) show that the model accurately predicts MC activity on novel stimuli. (B) Same as A but for a different neuron. (C) Structure of the GLM neuron model. Model parameters describe a temporal stimulus filter, a postspike filter, and a constant bias term. An exponential nonlinearity defines an instantaneous spike rate and is used to draw noisy spikes. (D) GLM models accurately predict 86 ± 11% (mean ± SEM) of stimulus-evoked activity across all MCs, computed as the correlation coefficient between MC and model PSTH. For all neurons, the GLM fits were better than LNP models. (E–G) Model parameters for all MCs. Each line corresponds to parameters for a unique neuron and is colored by mean firing rate. (E) Temporal stimulus filters model differential stimulus specificity of neurons. (F) Exponentiated postspike filters, plotted as a multiplicative gain in spike probability following a spike at t = 0 ms. Values less (greater) than 1 indicate a decreased (increased) spike probability. (G) Bias terms also show considerable variation. Same y axis as F.
Fig. 2.
Fig. 2.
Using simulated ensemble responses to study stimulus representation in diverse neural populations. (A) Schematic of the paradigm used to study how neural populations represent stimuli. Following the generation of noisy stimuli, population spike responses were simulated using the MC models. Bayesian decoding was used to estimate the most probable stimulus given the population response and then compared with the actual stimulus. (B–D) Stimulus encoding by single neurons. Stimulus statistics and coloring of neurons same as in Fig. 1. (B) Stimulus (Top; black), spike trains (Bottom), and reconstructions (Top; cyan, orange) for two example neurons. These neurons encode the same stimulus differently, as evidenced by their unique spike trains and stimulus reconstructions. (C) Quantifying stimulus representation using mutual information (mean ± SEM, n = 44 cells) shows that a neuron’s information rate is strongly correlated with its firing rate (r = 0.87). Boxes indicate neurons shown in B. (D) As in C, but plotted as average information conveyed by single spikes as a function of neuron reliability. (E–G) Stimulus encoding by neuron pairs. (E) Mutual information for all neuron pairs with neurons ordered along axes by increasing firing rate. Values on (off) diagonal correspond to homogeneous (heterogeneous) pairs. (F) As in E but plotted as the normalized informational redundancy of the neuron pair. Positive (negative) values indicate population redundancy (synergy) where zero indicates independent stimulus encoding. 90% of pairs were redundant, yet overall redundancy values were small, indicating near-independent encoding. (G) Homogeneous pairs (Hom) are significantly more redundant than heterogeneous pairs (Het; P = 2.5*10−16, Wilcoxon, n = 44 and 946 pairs, respectively).
Fig. 3.
Fig. 3.
Populations composed of diverse neurons effectively encode stimuli with very different frequency spectra. (A–C) Example stimulus (Top; black), rasters (Bottom), and reconstructions (Top) for a homogeneous population composed of five copies of the most informative neuron (pop 1, red) and a heterogeneous population composed of five neurons with diverse properties (pop 2, green) for three stimuli with different power spectra: stimulus 1, Gaussian white noise (GWN) convolved with an alpha function with τ = 3 ms (A); stimulus 2, GWN with alpha function with τ = 10 ms (B); stimulus 3, Ornstein–Uhlenbeck process with τ = 40 ms (C). Note that although both populations can represent the stimulus in A well, only population 2, the diverse population, can also represent the lower frequency stimuli in B and C. (D) Neuron GLM parameters for the populations in A–C. Top indicates parameters for population 1 and Bottom for population 2 (green shades indicate different neurons). (E) Power spectra for the three stimuli in A–C (dotted, solid, dashed respectively). (F and G) Relative rankings of stimulus reconstruction accuracy for all homogeneous (hom-, red) and 200 randomly sampled heterogeneous populations (het-, green) for stimuli 1 versus 2 (F) or 1 versus 3 (G). Populations in Top Right indicate those which represent both stimuli accurately. Asterisks indicate populations highlighted in A–C. Note that hom populations are among the bottom populations and are further from the unity line than het populations. (H) Average rank of het and hom populations across eight spectrally unique stimuli (Materials and Methods). Het populations are consistently ranked higher (more accurate) than hom ones (P = 0.002, paired Wilcoxon). (I) Plot of generalizability, defined as the correlation of population ranks on stimulus pairs, for hom and het populations across all pairs of eight stimulus types. Each dot corresponds to the generalizability between a pair of stimulus types (n = 28 total pairs). Het populations are significantly more likely than hom to generalize to novel kinds of stimuli (P = 1.5*10−4, paired Wilcoxon).
Fig. 4.
Fig. 4.
Populations optimized for stimulus representation combine homogeneity with diversity. (A) Cartoon of greedy search algorithm to estimate the population that best represents a particular type of stimulus. Neurons were iteratively added, one at a time, to the current population of neurons such that the neuron chosen maximized the population's reconstruction accuracy. To allow for homogeneity, neurons could be added more than once (e.g., two red neurons). (B and C) Visualization of the population selected to best represent a white-noise stimulus (B) or a low-frequency stimulus (C). Graphs show neurons (as dots) projected into a 2D space using principal component analysis (PCs). Population sizes vary from n = 1 to n = 10, numbers next to dots correspond to algorithm iteration step when each neuron was added. Note that certain neurons are chosen multiple times and that stimulus type dictates the selected population diversity. (D) GLM parameter diversity of the greedy-search-selected populations (blue) averaged over eight different choices of stimulus spectra relative to homogeneous (red) and randomly sampled heterogeneous populations (green), n = 10 neurons per population. Asterisks indicate where greedy search populations are significantly less diverse than heterogeneous (P < 0.05) and population diversity has been normalized to that of randomly sampled heterogeneous. Error bars indicate SEM (blue) and interquartile range (green). (E) Greedy-search population diversity for specific stimlus types. Colors indicate different stimulus types corresponding to inset power spectrum (magenta, stimulus as in B; cyan, Ornstein–Uhlenbeck process with τ = 10 ms; black, stimulus as in C), open circles indicate multiple runs of the greedy search algorithm (n = 10 per stimulus type), asterisks indicate significant differences in population diversity between stimulus types. (F) Population decoding error as a function of stimulus filter diversity for 200 randomly sampled populations (dots, n = 5 neurons per population) for stimulus 1 and 2 as in Fig. 3 (A and B, respectively). Least-squares fits using a second-order polynomial (blue) show that on average there is an intermediate level of stimulus filter diversity where decoding error is minimized (regression P < 0.01). (G) Cartoon showing that population diversity should be preferentially selected with respect to the specific incoming stimulus distribution.

References

    1. Puchalla JL, Schneidman E, Harris RA, Berry MJ. Redundancy in the population code of the retina. Neuron. 2005;46(3):493–504. - PubMed
    1. Moore CI, Carlen M, Knoblich U, Cardin JA. Neocortical interneurons: from diversity, strength. Cell. 2010;142(2):189–193. - PMC - PubMed
    1. Marder E, Taylor AL. Multiple models to capture the variability in biological neurons and networks. Nat Neurosci. 2011;14(2):133–138. - PMC - PubMed
    1. Altschuler SJ, Wu LF. Cellular heterogeneity: do differences make a difference? Cell. 2010;141(4):559–563. - PMC - PubMed
    1. Padmanabhan K, Urban NN. Intrinsic biophysical diversity decorrelates neuronal firing while increasing information content. Nat Neurosci. 2010;13(10):1276–1282. - PMC - PubMed

Publication types

LinkOut - more resources