. 2013 Oct;94(4):563-73.
doi: 10.1189/jlb.1112562. Epub 2013 Apr 29.

Regulatory B cells suppress imiquimod-induced, psoriasis-like skin inflammation

Affiliations

Regulatory B cells suppress imiquimod-induced, psoriasis-like skin inflammation

Koichi Yanaba et al. J Leukoc Biol. 2013 Oct.

Abstract

Psoriasis is an inflammatory cutaneous disorder characterized by marked epidermal thickening and Th1 and Th17 cell infiltration. At present, the contribution of B cells to the pathogenesis of psoriasis is unclear. In mice, topical application of imiquimod induces inflamed skin lesions and serves as an experimental animal model for human psoriasis. In this study, we showed that imiquimod-induced skin inflammation was more severe in CD19(-/-) than WT mice. These inflammatory responses were negatively regulated by a unique IL-10-producing CD1d(hi)CD5(+) regulatory B cell subset (B10 cells) that was absent in CD19(-/-) mice and represented only 1-2% of splenic B220(+) cells in WT mice. Splenic B10 cells entered the circulation and migrated to draining LNs during imiquimod-induced skin inflammation, thereby suppressing IFN-γ and IL-17 production. Furthermore, adoptive transfer of these B10 cells from WT mice reduced inflammation in CD19(-/-) mice. The present findings provide direct evidence that B10 cells regulate imiquimod-induced skin inflammation and offer insights into regulatory B cell-based therapies for the treatment of psoriasis.

Keywords: B10 cells; IL-10; cytokines.


Figures
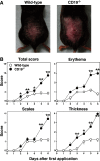
Figure 1.
Figure 1.. Increased severity of imiquimod-induced skin inflammation in CD19−/− mice.
The shaved back skin of WT and CD19−/− mice was treated daily with imiquimod cream or control cream. (A) Representative phenotypical presentation of mouse back skin after 6 days of imiquimod treatment. (B) The severity of imiquimod-induced skin inflammation. Erythema, scaling, and thickness of back skin were scored daily from 0 to 4. The total score was calculated by summing individual scores for erythema, scales, and thickness in each mouse. Values represent means (±sem) from greater than/equal to five mice/group. Significant differences between sample means are indicated: *P < 0.05; **P < 0.01.
Figure 2.
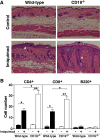
Figure 2.. CD19−/− enhanced the severity of imiquimod-induced skin inflammation.
Skin sections were harvested from WT and CD19−/− mice after 6 days of imiquimod treatment. (A) Imiquimod treatment induced hyperkeratosis (white asterisks), parakeratosis (black arrow), acanthosis (black asterisks), spongiosis (green arrows), and elongation of the rete ridges (white arrows). Representative skin sections from WT and CD19−/− mice stained with H&E. Original magnifications, ×200. (B) The numbers of CD4+ T cells, CD8+ T cells, and B220+ B cells/field of view (×400) were counted. Values represent means (±sem) from greater than/equal to four mice/group. Significant differences between sample means are indicated: *P < 0.05; **P < 0.01**.
Figure 3.
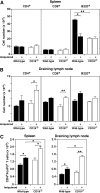
Figure 3.. The effect of CD19−/− on the numbers of CD4+ T cells, CD8+ T cells, and B220+ cells in the spleen and draining LNs during imiquimod-induced skin inflammation.
The numbers of CD4+ T cells, CD8+ T cells, and B220+ cells in the spleen (A) and draining LNs (B) of naïve (−) or imiquimod-treated (+) mice. (C) The numbers of CD4+FoxP3+ T cells in the spleen and draining LNs of naïve or imiquimod-treated mice. Values represent means (±sem) from greater than/equal to four mice/group. Significant differences between sample means are indicated: *P < 0.05; **P < 0.01.
Figure 4.
Figure 4.. IL-10-producing splenic B10 cells disappeared during imiquimod-induced skin inflammation.
(A) CD1dhiCD5+ B cells are the predominant IL-10-producing B cell subset. Splenocytes from WT mice were cultured with LPS, PMA, ionomycin, and monensin for 5 h before permeabilization and staining using B220, CD1d, CD5, and IL-10 mAb. IL-10 production by B220+ B cells within the CD1dhiCD5+ and non-CD1dhiCD5+ subpopulations is shown with the proportions of IL-10+ cells within the indicated gates. (B) Splenic IL-10-producing B cell proportions and absolute numbers during imiquimod-induced skin inflammation in WT and CD19−/− mice. Splenocytes were isolated from naïve or imiquimod-treated mice, and B220+ splenocytes were purified. Purified B cells were incubated in the presence of LPS, PMA, ionomycin, and monensin for 5 h. B cells were stained with B220 mAb. After permeabilization, the cells were stained with IL-10 mAb. Representative results demonstrate the proportion of IL-10-producing cells of the total B220+ B cells within the indicated gates. Bar graphs indicate mean (±sem) percentages and numbers of B cells producing IL-10. (C) CD1dhiCD5+ B cell proportions and absolute numbers during imiquimod-induced skin inflammation in WT and CD19−/− mice. Splenocytes were isolated from naïve or imiquimod-treated mice and analyzed by flow cytometry for CD1d, CD5, and B220 immunofluorescence. Representative results demonstrate the proportion of CD1dhiCD5+ B cells of the total B220+ B cells within the indicated gates. Bar graphs indicate mean (±sem) percentages and numbers of CD1dhiCD5+ B cells. (B and C) Significant differences between sample means are indicated: **P < 0.01.
Figure 5.
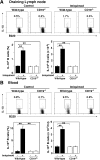
Figure 5.. Changes in B10 cell frequencies and numbers within draining LNs and blood during imiquimod-induced skin inflammation.
Mononuclear cells were isolated from draining LNs (A) or blood (B) in naïve or imiquimod-treated mice. Representative results demonstrate the frequencies of IL-10-producing cells after LPS, PMA, ionomycin, and monensin for 5 h within the indicated gates among total B220+ B cells. Bar graphs indicate mean (±sem) percentages and numbers of B cells that produced IL-10. Significant differences between sample means are indicated: **P < 0.01.
Figure 6.
Figure 6.. Phenotypes of IL-10-producing B cells in the draining LNs and blood during imiquimod-induced skin inflammation.
IL-10-producing B cells from the draining LNs and blood in imiquimod-treated WT mice expressed CD1d and CD5. Mononuclear cells were isolated from draining LNs (A) or blood (B) in imiquimod-treated WT mice and were cultured with LPS, PMA, ionomycin, and monensin for 5 h before permeabilization and staining with CD1d, CD5, B220, and IL-10 mAb.
Figure 7.
Figure 7.. Cytokine mRNA expression in splenic lymphocytes (A) draining LN lymphocytes (B), and inflamed skin (C) of WT and CD19−/− mice.
Skin samples, draining LN, and spleen lymphocytes were harvested from naïve or imiquimod-treated mice. IFN-γ and IL-17A mRNA levels were quantified by real-time PCR analysis and normalized with the internal control GAPDH. Values represent means (±sem) from greater than/equal to four mice/group. Significant differences between sample means are indicated: *P < 0.05; **P < 0.01.
Figure 8.
Figure 8.. IFN-γ and IL-17A production by CD4+ T cells from the draining LNs during imiquimod-induced skin inflammation.
Numbers indicate percentages of CD4+ T cells within the indicated gates. Bar graphs indicate mean (±sem) percentages of CD4+ cells that produced IFN-γ or IL-17A. Significant differences between sample means are indicated: *P < 0.05; **P < 0.01.
Figure 9.
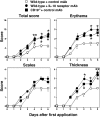
Figure 9.. The suppression of imiquimod-induced skin inflammation is IL-10-dependent.
Imiquimod-induced skin inflammation in WT or CD19−/− mice treated with control or IL-10R-specific mAb on Days 0, 3, and 5. Significant differences between sample means are indicated: *P < 0.05; **P < 0.01.
Figure 10.
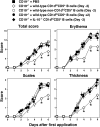
Figure 10.. Regulatory CD1dhiCD5+ B10 cells suppress disease symptoms in imiquimod-induced skin inflammation.
CD1dhiCD5+ or non-CD1dhiCD5+ B cells were purified from naïve WT or IL-10−/− mice by cell sorting. Purified cells were transferred into CD19−/− mice. Imiquimod was administered to the recipient mice 2 days before or after transfer. Significant differences between PBS-treated CD19−/− mice versus other groups are indicated: *P < 0.05. Values represent means (±sem) from greater than/equal to three mice/group.
Figure 11.
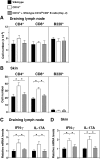
Figure 11.. The effect of transferring CD1dhiCD5+ B10 cells into CD19−/− mice 2 days before induction.
(A) The numbers of CD4+ T cells, CD8+ T cells, and B220+ cells in draining LNs. (B) The numbers of CD4+ T cells, CD8+ T cells, and B220+ B cells/field of view (×400) were counted in the inflamed skin sections. IFN-γ and IL-17A mRNA expression in draining LN lymphocytes (C) and inflamed skin (D). Values represent means (±sem) from greater than/equal to three mice/group. Significant differences between sample means are indicated: *P < 0.05.

Comment in

References

    1. Nestle F. O., Kaplan D. H., Barker J. (2009) Psoriasis. N. Engl. J. Med. 361, 496–09 - PubMed
    1. Lowes M. A., Kikuchi T., Fuentes-Duculan J., Cardinale I., Zaba L. C., Haider A. S., Bowman E. P., Krueger J. G. (2008) Psoriasis vulgaris lesions contain discrete populations of Th1 and Th17 T cells. J. Invest. Dermatol. 128, 1207–1211 - PubMed
    1. Schon M. P., Ruzicka T. (2001) Psoriasis: the plot thickens. Nat. Immunol. 2, 91. - PubMed
    1. Gilliet M., Conrad C., Geiges M., Cozzio A., Thurlimann W., Burg G., Nestle F. O., Dummer R. (2004) Psoriasis triggered by Toll-like receptor 7 agonist imiquimod in the presence of dermal plasmacytoid dendritic cell precursors. Arch. Dermatol. 140, 1490–1495 - PubMed
    1. Patel U., Mark N. M., Machler B. C., Levine V. J. (2011) Imiquimod 5% cream induced psoriasis: a case report, summary of the literature and mechanism. Br. J. Dermatol. 164, 670–672 - PubMed

Publication types

MeSH terms