Review
. 2013 Apr 23:7:74.
doi: 10.3389/fncir.2013.00074. eCollection 2013.

Integrating anatomy and function for zebrafish circuit analysis

Affiliations
Review

Integrating anatomy and function for zebrafish circuit analysis

Aristides B Arrenberg et al. Front Neural Circuits. .

Abstract

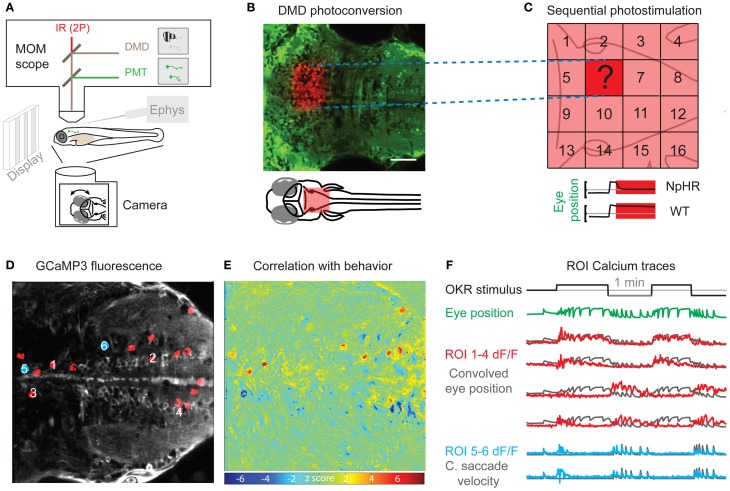
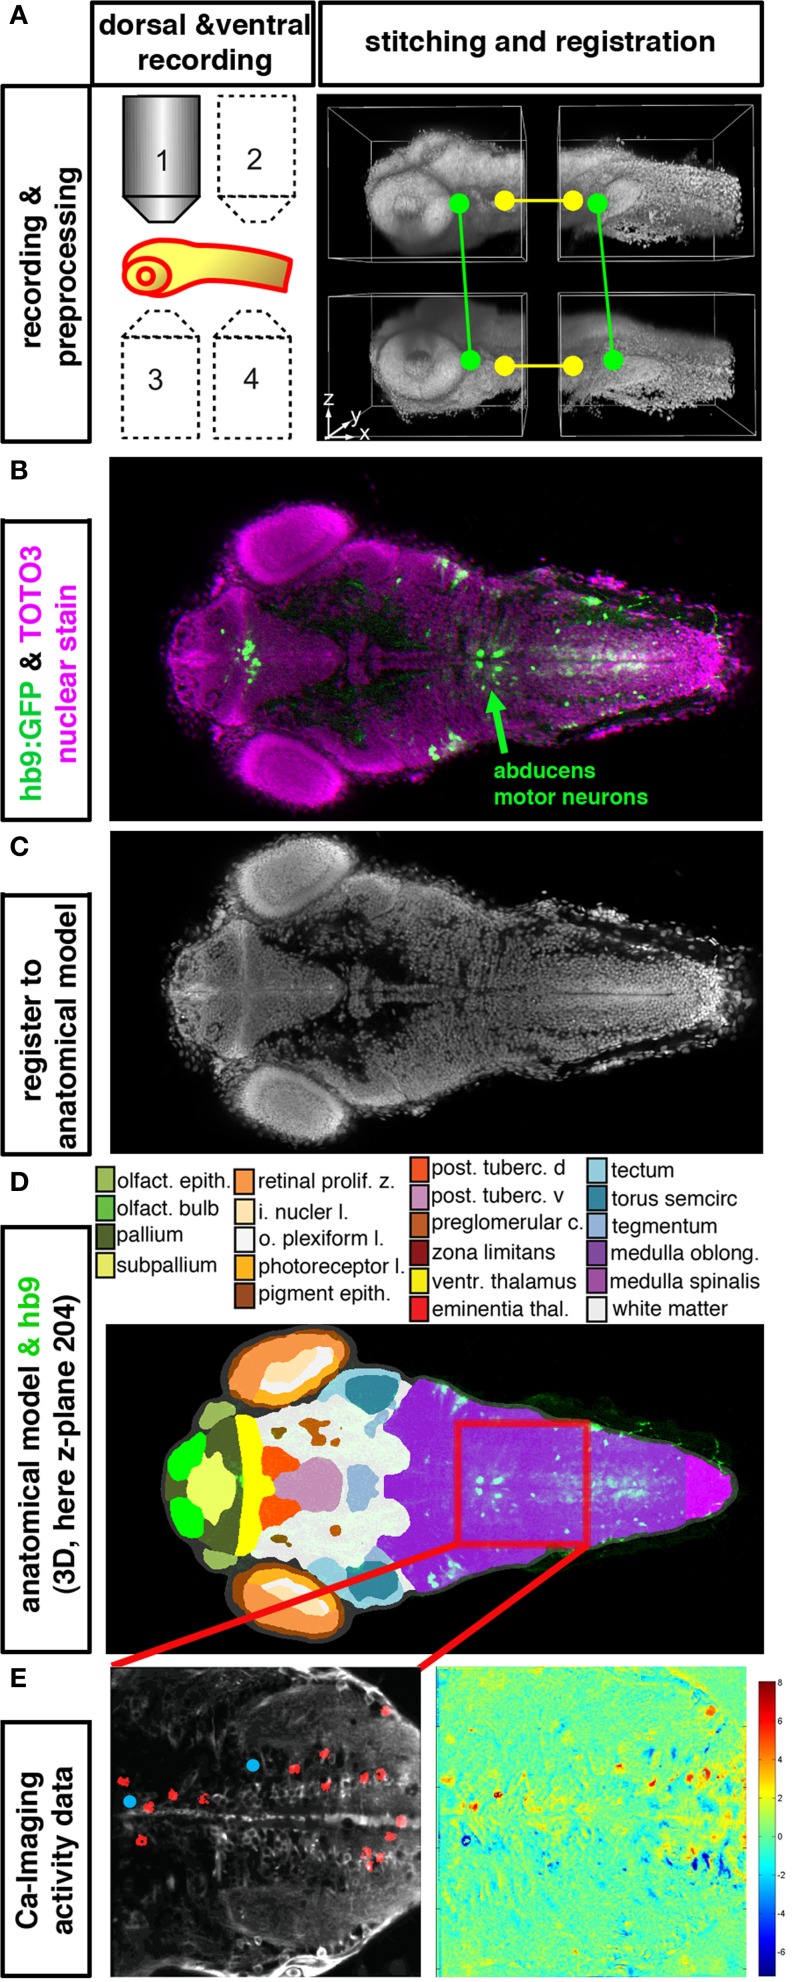
Due to its transparency, virtually every brain structure of the larval zebrafish is accessible to light-based interrogation of circuit function. Advanced stimulation techniques allow the activation of optogenetic actuators at different resolution levels, and genetically encoded calcium indicators report the activity of a large proportion of neurons in the CNS. Large datasets result and need to be analyzed to identify cells that have specific properties-e.g., activity correlation to sensory stimulation or behavior. Advances in three-dimensional (3D) functional mapping in zebrafish are promising; however, the mere coordinates of implicated neurons are not sufficient. To comprehensively understand circuit function, these functional maps need to be placed into the proper context of morphological features and projection patterns, neurotransmitter phenotypes, and key anatomical landmarks. We discuss the prospect of merging functional and anatomical data in an integrated atlas from the perspective of our work on long-range dopaminergic neuromodulation and the oculomotor system. We propose that such a resource would help researchers to surpass current hurdles in circuit analysis to achieve an integrated understanding of anatomy and function.

Keywords: brain anatomy; calcium imaging; neural circuits; neuronal types; optogenetics; zebrafish model system.


Figures

Figure 1
Figure 1
Perturbation and Measurement of brain activity via optogenetics. (A) Scheme of a moveable objective microscope (MOM) that allows two photon (2P) calcium imaging (PMT, photomultiplier tubes) and photostimulation via a digital micro mirror device (DMD). At the same time, the animal can be visually stimulated and eye or tail movements are recorded with a camera. (B) A rectangular region of interest was photoconverted with the DMD device in an Et(E1b:Gal4)s1101t; Tg(UAS:Kaede)s1999t transgenic animal. (C) Schematic for the systematic mapping of circuit function by measuring behavioral performance (e.g., eye position stability) during sequential photostimulation (16 regions shown here) in animals transgenic for optogenetic actuators (e.g., halorhodopsin, NpHR). The question mark illustrates an individual tested region as shown in (B). (D) Averaged frame of a calcium imaging time series during visual optokinetic response (OKR) stimulation in an Et(E1b:Gal4)s1101t; Tg(UAS:GCaMP3) transgenic 5-day-old animal. Red regions of interest (ROIs) correspond to highly correlated pixels in (E). Blue regions of interest are correlated with quick eye movements. (E) A heat map of Z-scores identifies pixels correlated with average eye position. The algorithm is based on Miri et al. (2011b) and provides an unbiased, quick way of correlating pixel time series with any time-varying regressor of interest. The Z-score heat map for correlation with saccadic eye movements [blue positions in (D)] is not shown. (F) The black line indicates the velocity of the visual stimulus (vertical stripes) and the green line shows the average eye position. The calcium fluorescence ΔF/F signal of the ROIs 1–4 in (D) (red) is plotted over eye position regressor traces (black). ROIs 1 and 2 have a positive correlation with the eye position regressor and ROIs 3 and 4 are anti-correlated with the eye position regressor. The lower two calcium signal traces (blue) correspond to the blue positions in (D) and are correlated with the occurrence of quick eye movements (saccades). The black traces show the high-pass filtered eye velocity regressor. Note that all six black regressors were convolved to account for the slow calcium indicator kinetics. Scale bar: 50 μm.
Figure 2
Figure 2
Integration of anatomical, gene expression, and functional information in 3D. (A–E) High resolution datasets generated using an anatomical reference stain for each developmental stage may serve to establish an anatomical reference to register different data types into an anatomical and functional atlas of the nervous system. The Virtual Brain Explorer for Zebrafish (ViBE-Z) provides a framework for generation of high resolution 3D image stacks and for registration into an anatomical model (Ronneberger et al., 2012). (A) For single cell resolution documentation of the whole zebrafish brain, image stacks of rostral and caudal parts of the brain are recorded from ventral and dorsal sides using standard single photon confocal microscopes. Fluorescent stain of all cell nuclei is used to obtain anatomical information, and also to correct for loss of signal in deep tissues, assuming that all nuclei contain the same amount of DNA and have similar stain intensities. ViBE-Z stitches the individual stacks into one high resolution 3D data volume and performs correction of optical attenuation (light absorption and scattering in tissue). (B) Example of a ViBE-Z processed dataset of a 3-day-old larva showing GFP expression from Tg(hb9:GFP) (Flanagan-Steet et al., 2005) and TOTO3 fluorescent nuclear stain. (C) The fluorescent stain of cell nuclei is used by ViBE-Z to extract landmark information and register the experimental datasets in 3D to a reference larva. (D) The anatomical model of the reference embryo may now be combined with the experimental data set. Here, a dorsal view at focal plane z_204 of the reference larva is shown. The experimental Tg(hb9:GFP) expression provides neuronal information even in the medulla oblongata hindbrain region, which has only few anatomical annotations in reference databases (www.ZFIN.org). (E) In the future, as soon as anatomical references may be recorded also in live larva, the anatomical and gene expression information in ViBE-Z may be used to identify neurons which have defined recorded activity patterns. In this case, neurons with activity patterns correlating with oculomotor activity have been detected (see Figure 1), and ViBE-Z may be used to determine whether some of these active neurons may correspond to abducens motor neurons, which are labeled in the Tg(hb9:GFP) transgenic line.

References

    1. Ahrens M. B., Keller P. J. (2013). Whole-brain functional imaging at cellular resolution using light-sheet microscopy. Nat. Methods. [Epub ahead of print]. 10.1038/nmeth.2434 - DOI - PubMed
    1. Ahrens M. B., Li J. M., Orger M. B., Robson D. N., Schier A. F., Engert F., et al. (2012). Brain-wide neuronal dynamics during motor adaptation in zebrafish. Nature 485, 471–477 10.1038/nature11057 - DOI - PMC - PubMed
    1. Aizenberg M., Schuman E. M. (2011). Cerebellar-dependent learning in larval zebrafish. J. Neurosci. 31, 8708–8712 10.1523/JNEUROSCI.6565-10.2011 - DOI - PMC - PubMed
    1. Akemann W., Mutoh H., Perron A., Park Y. K., Iwamoto Y., Knopfel T. (2012). Imaging neural circuit dynamics with a voltage-sensitive fluorescent protein. J. Neurophysiol. 108, 2323–2337 10.1152/jn.00452.2012 - DOI - PubMed
    1. Akerboom J., Chen T.-W., Wardill T. J., Tian L., Marvin J. S., Mutlu S., et al. (2012). Optimization of a GCaMP calcium indicator for neural activity imaging. J. Neurosci. 32, 13819–13840 10.1523/JNEUROSCI.2601-12.2012 - DOI - PMC - PubMed

Publication types

LinkOut - more resources