. 2013 Apr 23:7:9.
doi: 10.3389/fnsys.2013.00009. eCollection 2013.

Cerebral low-molecular metabolites influenced by intestinal microbiota: a pilot study

Affiliations

Cerebral low-molecular metabolites influenced by intestinal microbiota: a pilot study

Mitsuharu Matsumoto et al. Front Syst Neurosci. .

Abstract

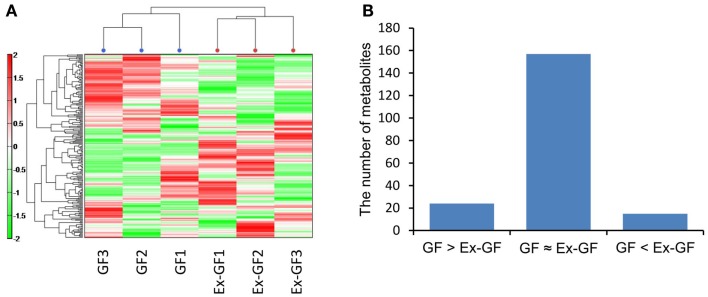
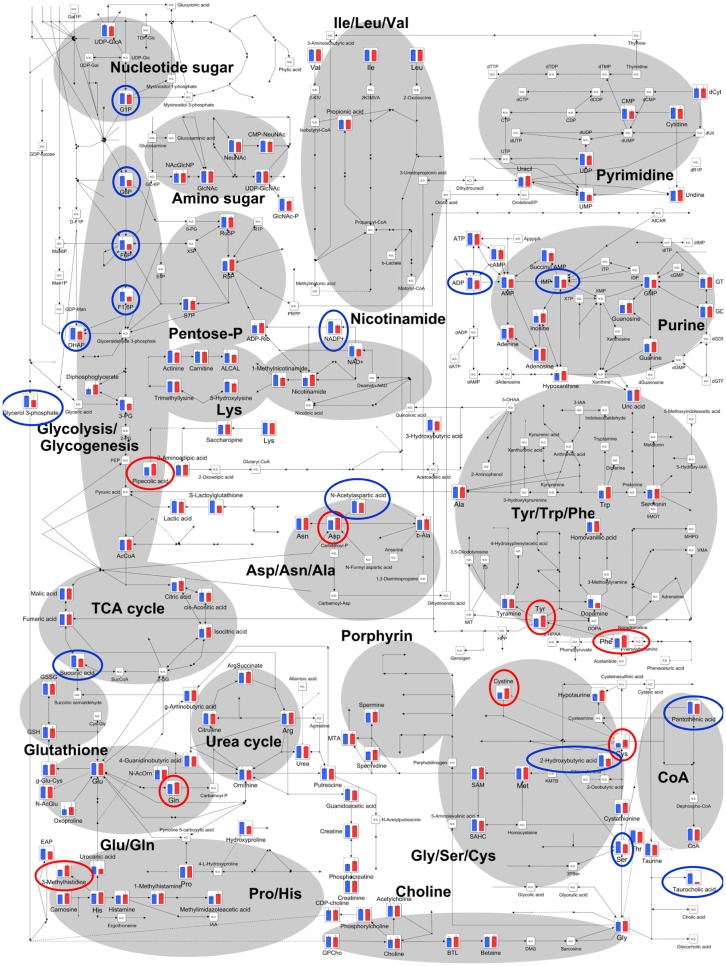
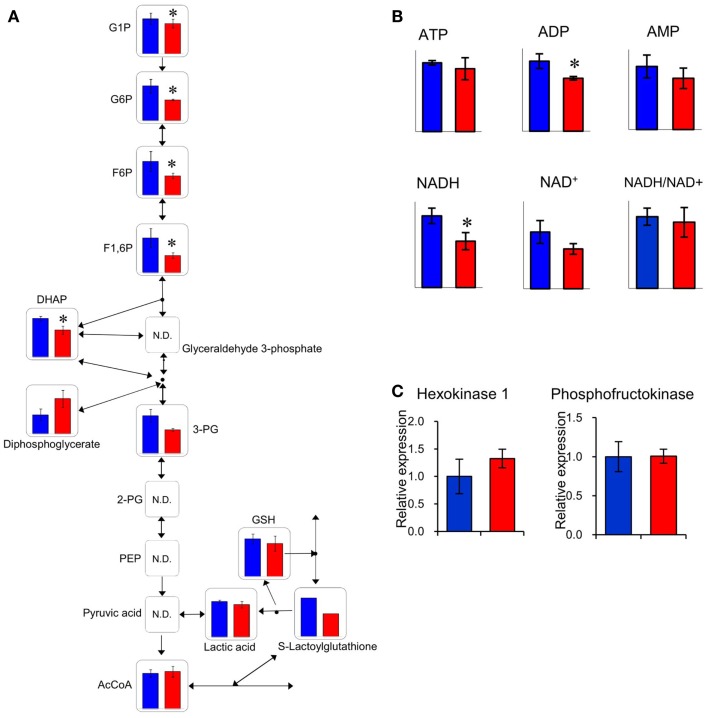
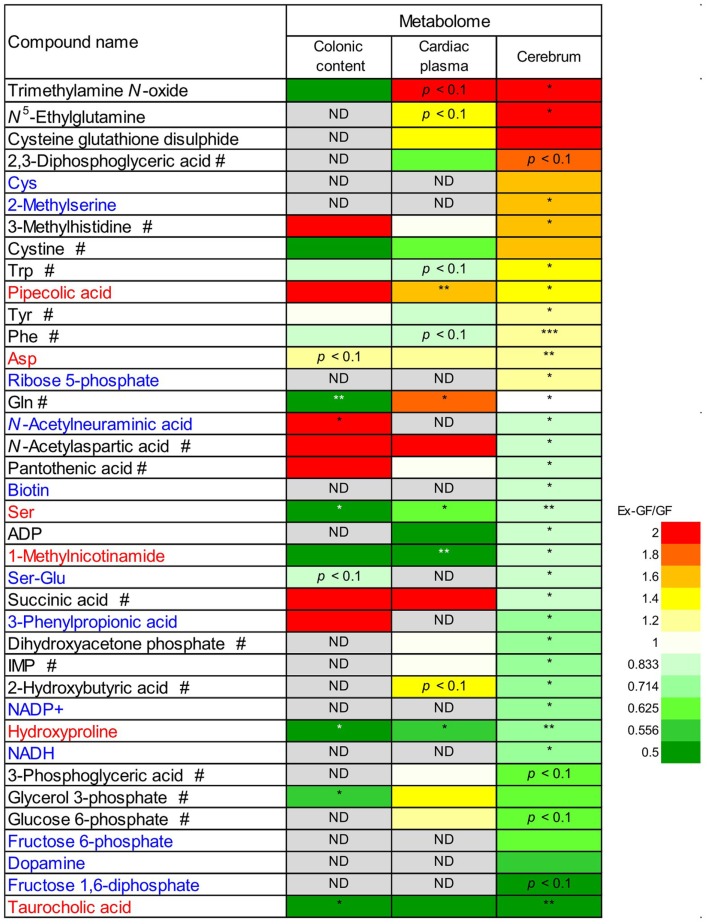
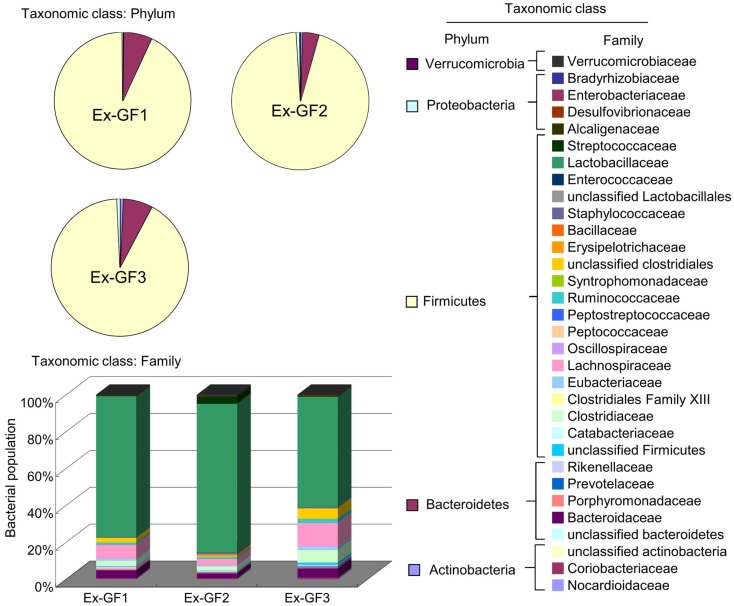
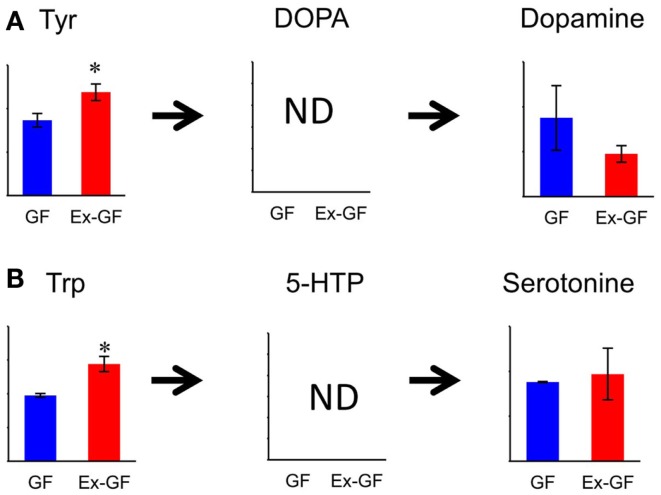
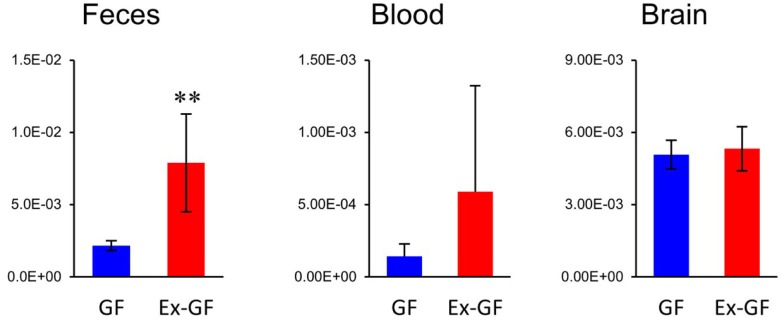
Recent studies suggest that intestinal microbiota influences gut-brain communication. In this study, we aimed to clarify the influence of intestinal microbiota on cerebral metabolism. We analyzed the cerebral metabolome of germ-free (GF) mice and Ex-GF mice, which were inoculated with suspension of feces obtained from specific pathogen-free mice, using capillary electrophoresis with time-of-flight mass spectrometry (CE-TOFMS). CE-TOFMS identified 196 metabolites from the cerebral metabolome in both GF and Ex-GF mice. The concentrations of 38 metabolites differed significantly (p < 0.05) between GF and Ex-GF mice. Approximately 10 of these metabolites are known to be involved in brain function, whilst the functions of the remainder are unclear. Furthermore, we observed a novel association between cerebral glycolytic metabolism and intestinal microbiota. Our work shows that cerebral metabolites are influenced by normal intestinal microbiota through the microbiota-gut-brain axis, and indicates that normal intestinal microbiota closely connected with brain health and disease, development, attenuation, learning, memory, and behavior.

Keywords: cerebrum; gut-brain axis; intestinal microbiota; metabolome; neurotransmitter.


Figures

Figure 1
Figure 1
Difference in the cerebral metabolome between GF mice and Ex-GF mice. (A) Hierarchical clustering showing patterns of metabolites. Red and green indicate high and low concentrations of metabolites, respectively. (B) The number of cerebral metabolites in the group. GF > Ex-GF; GF ≈ Ex-GF; and GF < Ex-GF.
Figure 2
Figure 2
Differences of cerebral metabolites between GF mice and Ex-GF mice on the principal metabolic pathways. The relative quantities of the annotated metabolites are represented as bar graphs (blue, GF: red, Ex-GF). Metabolites surrounded by blue and red circles are of higher and lower concentrations, respectively, in GF mice than Ex-GF mice. ND, not detected.
Figure 3
Figure 3
Comparison of glycolytic metabolic activity between GF mice and Ex-GF mice. (A) The relative quantities of the annotated metabolites are represented as bar graphs (blue, GF: red, Ex-GF). (B) Relative quantities of ATP, ADP, AMP, and nicotinamides (*p < 0.05). (C) Cerebral gene expression of hexokinase and phosphofructokinase. Data are represented as mean ± SD (A,B) and mean ± SEM (C).
Figure 4
Figure 4
The boxplot of RSD% of all metabolites detected from colonic luminal content, cardiac plasma, and the cerebrum. Blue cross bars represent the comparison of means between Ex-GF mice and GF mice. *p < 0.05, **p < 0.01, ***p < 0.001 (GF vs. Ex-GF).
Figure 5
Figure 5
Relative quantitative ratio (Ex-GF/GF value) comparisons of 38 metabolites between GF mice and Ex-GF mice, colonic luminal content, cardiac plasma, and the cerebrum. Metabolites shown in red have similar Ex-GF/GF ratios between the colonic lumen, cardiac plasma, and the cerebrum. Metabolites shown in blue are below the detection limit in cardiac plasma, but were detected in the cerebrum. #These metabolites differed in Ex-GF/GF ratios between the cerebrum and cardiac plasma. *p < 0.05, **p < 0.01, ***p < 0.001 (GF vs. Ex-GF). ND, not detected.
Figure 6
Figure 6
Aggregate microbiota composition at the phylum and family levels in the colonic content of Ex-GF mice.
Figure 7
Figure 7
Relative quantitative comparisons of metabolites in the biosynthetic pathway for dopamine (A) and serotonin (B), in the cerebrum of GF mice and Ex-GF mice. Data are represented as mean ± SD. *p < 0.05, ***p < 0.001 (GF vs. Ex-GF).
Figure 8
Figure 8
Relative quantitative comparisons of GABA in colonic lumen content, cardiac plasma, and the cerebrum. Data are represented as mean ± SD. **p < 0.01.

References

    1. Backhed F., Ley R. E., Sonnenburg J. L., Peterson D. A., Gordon J. I. (2005). Host-bacterial mutualism in the human intestine. Science 307, 1915–192010.1126/science.1104816 - DOI - PubMed
    1. Camara R. J., Ziegler R., Begre S., Schoepfer A. M., von Kanel R. (2009). The role of psychological stress in inflammatory bowel disease: quality assessment of methods of 18 prospective studies and suggestions for future research. Digestion 80, 129–13910.1159/000226087 - DOI - PubMed
    1. Carlson S. E., House S. G. (1986). Oral and intraperitoneal administration of N-acetylneuraminic acid: effect on rat cerebral and cerebellar N-acetylneuraminic acid. J. Nutr. 116, 881–886 - PubMed
    1. Cryan J. F., Dinan T. G. (2012). Mind-altering microorganisms: the impact of the gut microbiota on brain and behaviour. Nat. Rev. Neurosci. 13, 701–71210.1038/nrn3346 - DOI - PubMed
    1. Daubner S. C., Le T., Wang S. (2011). Tyrosine hydroxylase and regulation of dopamine synthesis. Arch. Biochem. Biophys. 508, 1–1210.1016/j.abb.2010.12.017 - DOI - PMC - PubMed