. 2013 Apr 22:7:143.
doi: 10.3389/fnhum.2013.00143. eCollection 2013.

Neural response in obsessive-compulsive washers depends on individual fit of triggers

Affiliations

Neural response in obsessive-compulsive washers depends on individual fit of triggers

Ali Baioui et al. Front Hum Neurosci. .

Abstract

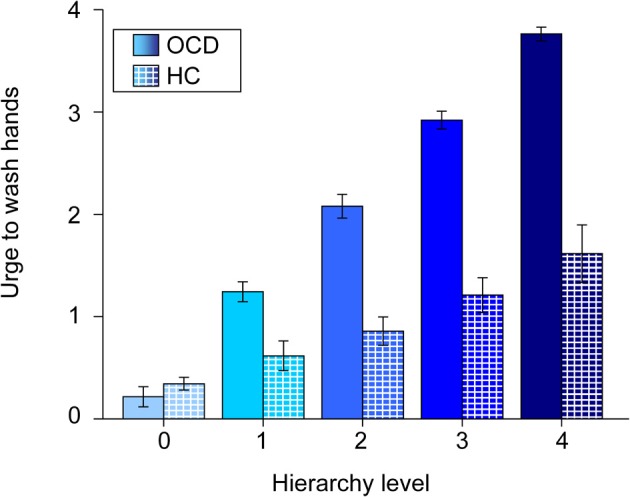
Background: Patients with obsessive-compulsive disorder (OCD) have highly idiosyncratic triggers. To fully understand which role this idiosyncrasy plays in the neurobiological mechanisms behind OCD, it is necessary to elucidate the impact of individualization regarding the applied investigation methods. This functional magnetic resonance imaging (fMRI) study explores the neural correlates of contamination/washing-related OCD with a highly individualized symptom provocation paradigm. Additionally, it is the first study to directly compare individualized and standardized symptom provocation.

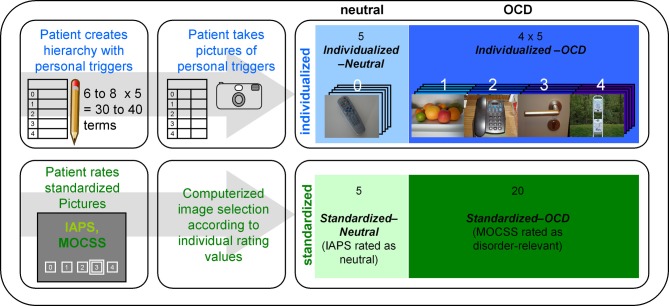
Methods: Nineteen patients with washing compulsions created individual OCD hierarchies, which later served as instructions to photograph their own individualized stimulus sets. The patients and 19 case-by-case matched healthy controls participated in a symptom provocation fMRI experiment with individualized and standardized stimulus sets created for each patient.

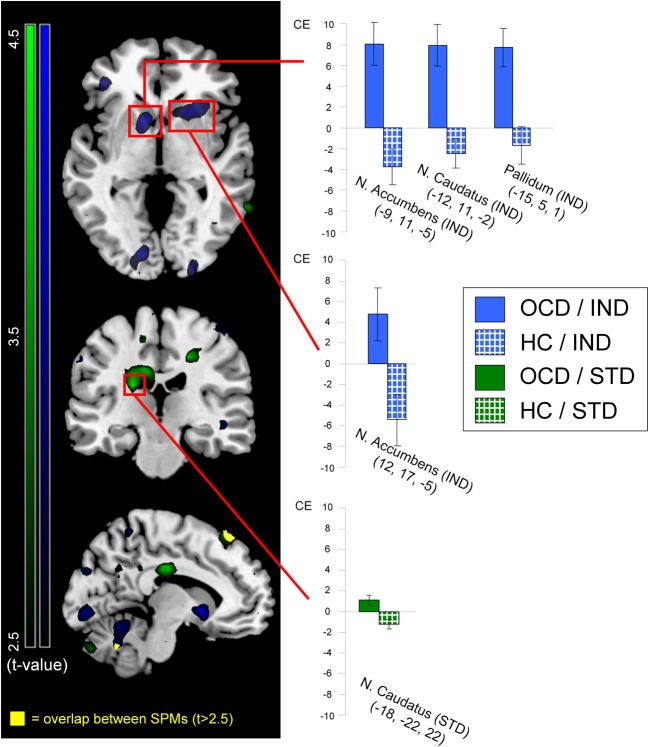
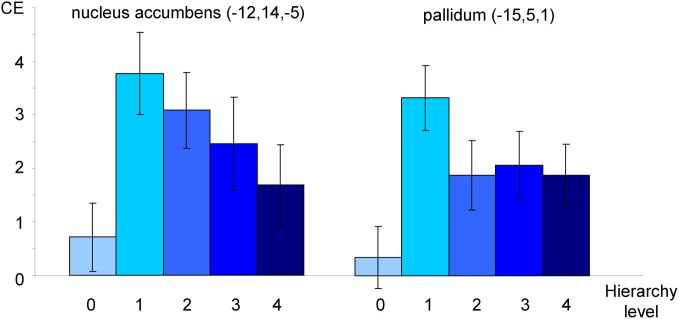
Results: OCD patients compared to healthy controls displayed stronger activation in the basal ganglia (nucleus accumbens, nucleus caudatus, pallidum) for individualized symptom provocation. Using standardized symptom provocation, this group comparison led to stronger activation in the nucleus caudatus. The direct comparison of between-group effects for both symptom provocation approaches revealed stronger activation of the orbitofronto-striatal network for individualized symptom provocation.

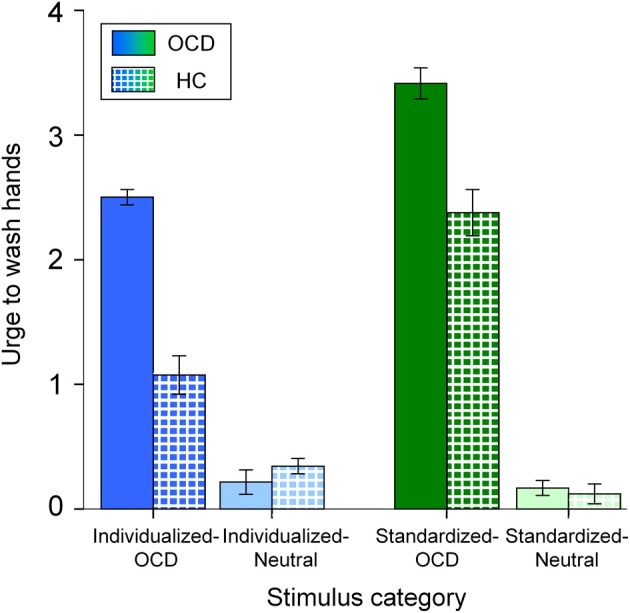
Conclusions: The present study provides insight into the differential impact of individualized and standardized symptom provocation on the orbitofronto-striatal network of OCD washers. Behavioral and neural responses imply a higher symptom-specificity of individualized symptom provocation.

Keywords: OCD; basal ganglia; contamination; fMRI; individualization; orbitofronto-striatal network; symptom provocation; washers.


Figures

Figure 1
Figure 1
Overview of the stimulus creation procedure carried out with every patient. The upper row represents the creation process for the individualized pictures, while the lower row represents the selection process for the standardized pictures. IAPS stands for “International Affective Picture System” (Lang et al., 2008); MOCSS stands for “Maudsley Obsessive-Compulsive Stimuli Set” (Mataix-Cols et al., 2009). Darker color shades represent higher stimulus intensities. The photographs depicted here are pictures taken by a participant of the OCD group (written informed consent for publication has been obtained). The white numbers above the photographs represent the stimulus intensity (the hierarchy level) of each picture. “Computerized image selection” refers to the image selection process described in the Stimuli and Design section.
Figure 2
Figure 2
Mean urge to wash hands (and standard errors of the mean) of patients (OCD; solid colors) and healthy controls (HC; patterned) for all stimulus categories. Note that the different colors depict the stimulus categories (dark blue: Individualized-OCD; light blue: Individualized-Neutral; dark green: Standardized-OCD; light green: Standardized-Neutral; also cp. Figure 1).
Figure 3
Figure 3
Neural activation of patients (OCD; solid colors) greater than healthy controls (HC; patterned) contrasted for individualized (IND; blue) and standardized (STD; green) symptom provocation. The figure displays statistical parametrical maps with whole-brain t-values for the between-group contrasts (OCD > HC) for both symptom provocation approaches. For illustration reasons, data were thresholded with t > 2.5 (see color bars for exact t-values) and displayed on a standard MNI brain template. Significant results from the voxel-wise ROI analyses are marked with red rectangles. Additionally, all significant between-group results are further depicted using the peak voxels of the OCD group: the bar graphs illustrate mean contrast estimates (CE) of the symptom provocation contrasts (with the corresponding standard errors of the mean) for patients (gray) and healthy controls (white). All coordinates are given in MNI space. The lower slice (x = −10; left hemisphere) depicts the only regions with an overlap (yellow) between both whole-brain statistical parametrical maps, with a threshold of t > 2.5; these regions were not included in any ROI and are depicted for illustrative purposes only.
Figure 4
Figure 4
Mean urge to wash hands (and standard errors of the mean) of patients (solid colors) and healthy controls (patterned) for individualized pictures plotted against hierarchy levels. Note that values of healthy controls are plotted against the original hierarchy level values of their respective matching partners. The different shades of blue represent the different original hierarchy level values (cp. Figure 1).
Figure 5
Figure 5
Neural activation of patients toward individualized pictures plotted against hierarchy levels. Mean contrast estimates (CE; and standard errors of the mean) in peak voxels in nucleus accumbens and pallidum as identified in an F-Test (see text). All coordinates are given in MNI space. The different shades of blue represent the different original hierarchy level values (cp. Figure 1).

References

    1. American Psychiatric Association. (1994). Diagnostic and Statistical Manual of Mental Disorders: DSM-IV-TR, 4th Edn. Washington, DC: American Psychiatric Press
    1. Baldi E., Bucherelli C. (2005). The inverted “u-shaped” dose-effect relationships in learning and memory: modulation of arousal and consolidation: nonlinearity in biology, toxicology, medicine. Nonlinearity Biol. Toxicol. Med. 3, 9–21 10.2201/nonlin.003.01.002 - DOI - PMC - PubMed
    1. Beck A. T., Steer R. A., Brown G. K. (1996). Manual for Beck Depression Inventory–II. San Antonio, TX: Psychological Corporation
    1. Bloch M. D., Landeros-Weisenberger M. D., Rosario M. D., Pittenger M. D., Leckman M. D. (2008). Meta-analysis of the symptom structure of obsessive-compulsive disorder. Am. J. Psychiatry 165, 1532–1542 10.1176/appi.ajp.2008.08020320 - DOI - PMC - PubMed
    1. Chamberlain S. R., Blackwell A. D., Fineberg N. A., Robbins T. W., Sahakian B. J. (2005). The neuropsychology of obsessive compulsive disorder: the importance of failures in cognitive and behavioural inhibition as candidate endophenotypic markers. Neurosci. Biobehav. Rev. 29, 399–419 10.1016/j.neubiorev.2004.11.006 - DOI - PubMed

LinkOut - more resources