

Short-term in-vitro expansion improves monitoring and allows affordable generation of virus-specific T-cells against several viruses for a broad clinical application
- PMID: 23630567
- PMCID: PMC3632539
- DOI: 10.1371/journal.pone.0059592
Short-term in-vitro expansion improves monitoring and allows affordable generation of virus-specific T-cells against several viruses for a broad clinical application
Abstract
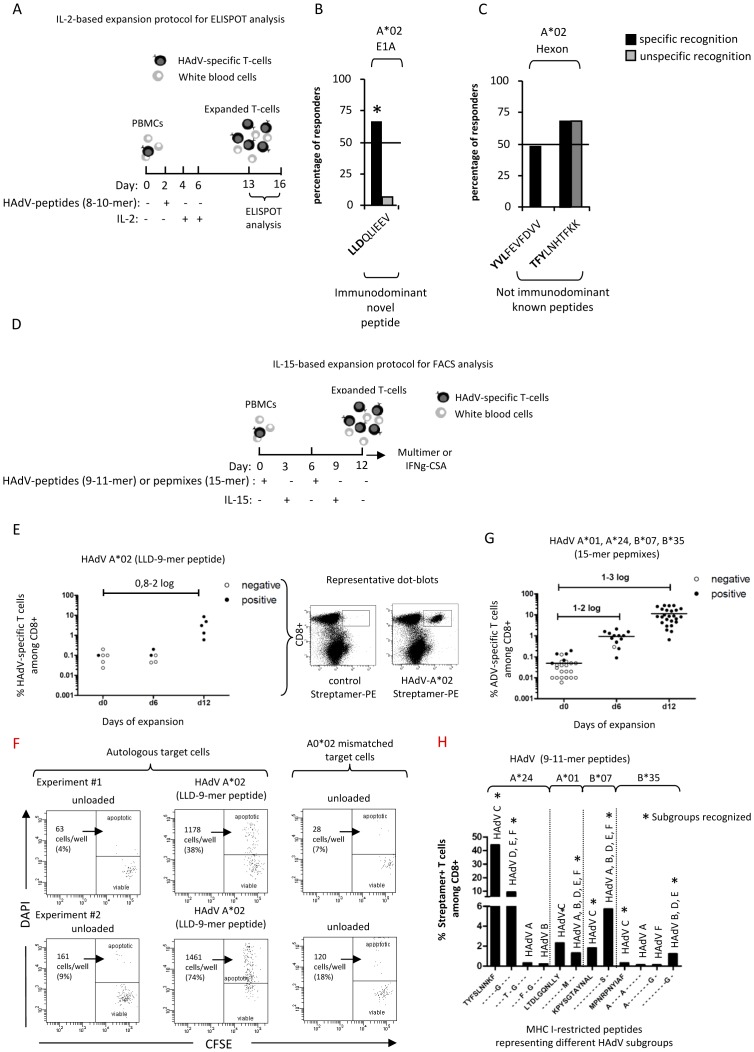
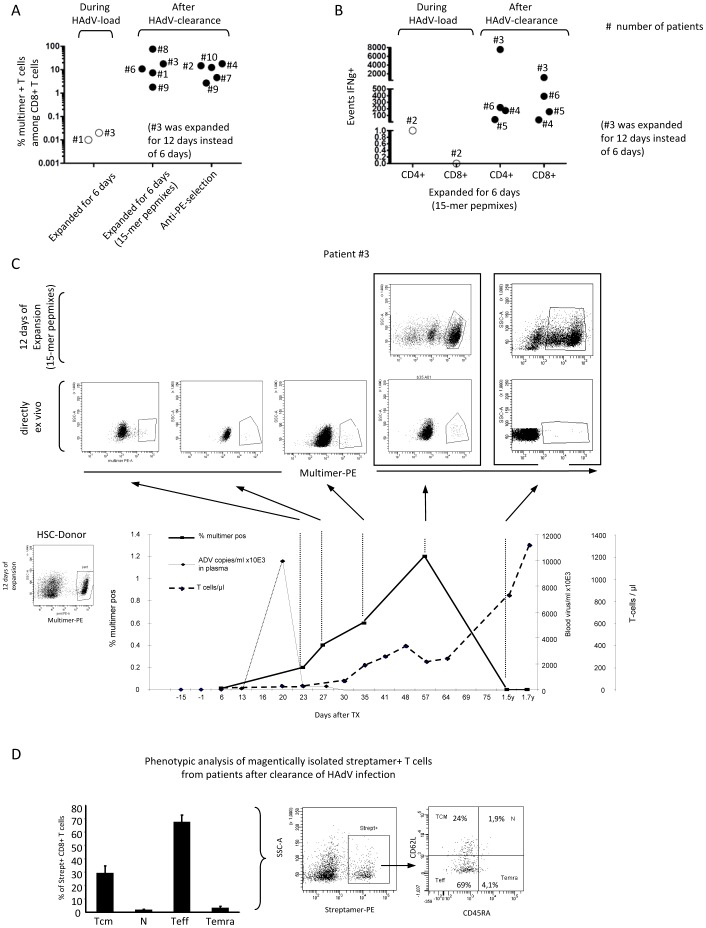
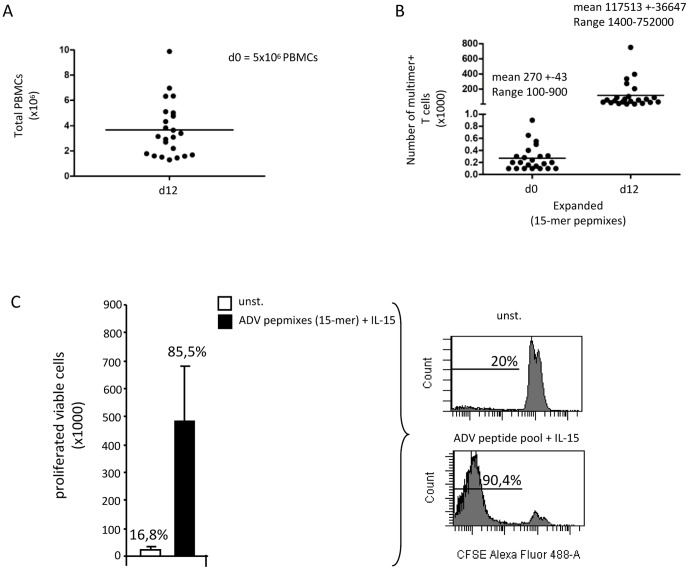
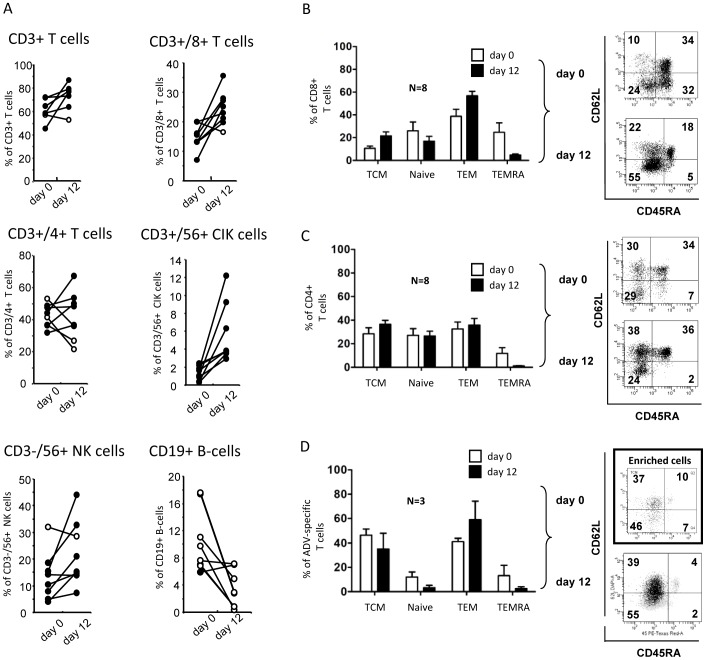
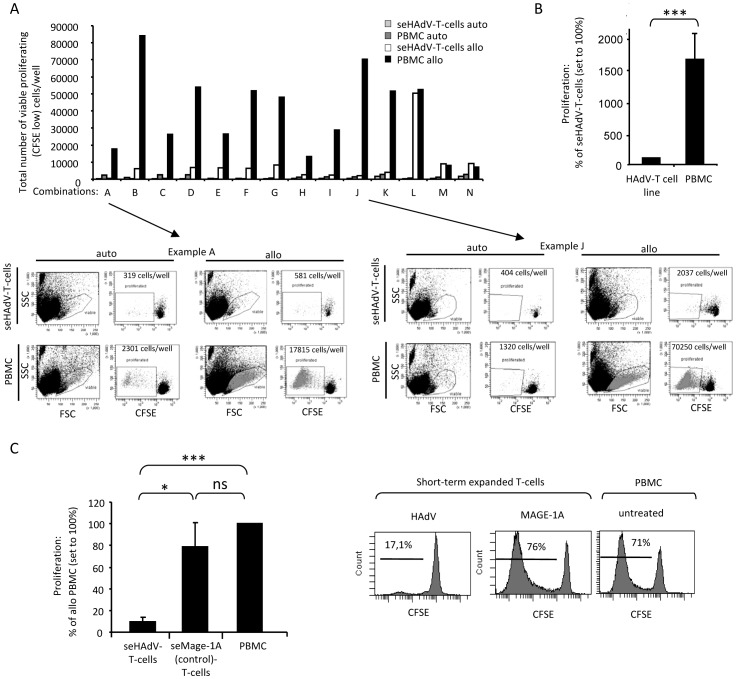
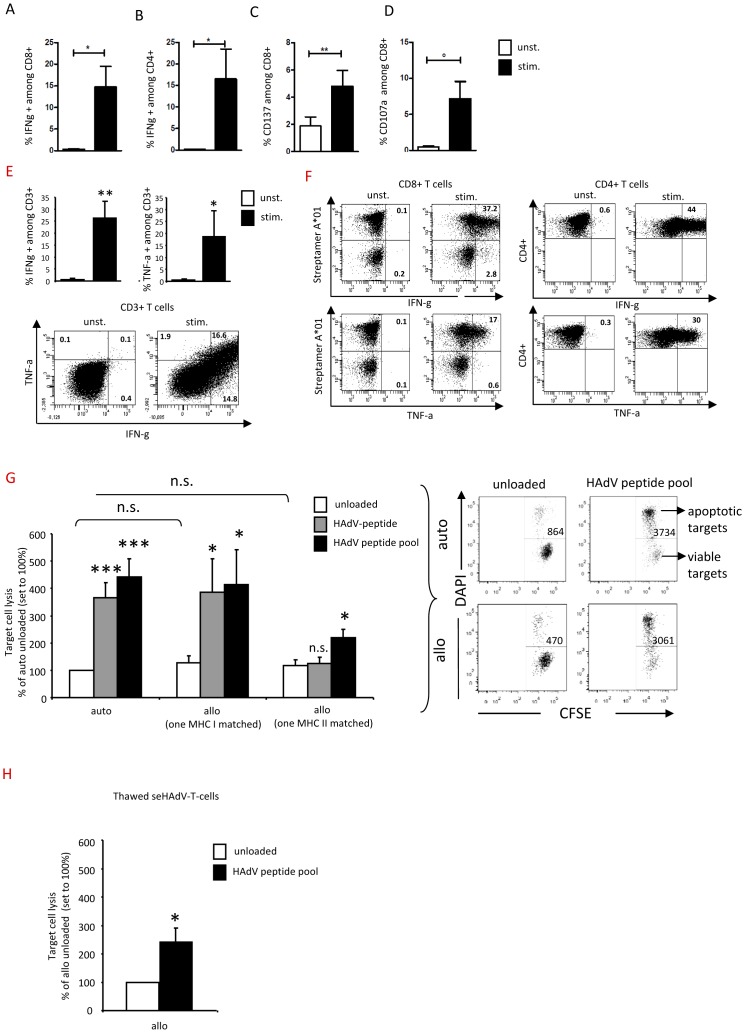
Adenoviral infections are a major cause of morbidity and mortality after allogeneic hematopoietic stem cell transplantation (HSCT) in pediatric patients. Adoptive transfer of donor-derived human adenovirus (HAdV)-specific T-cells represents a promising treatment option. However, the difficulty in identifying and selecting rare HAdV-specific T-cells, and the short time span between patients at high risk for invasive infection and viremia are major limitations. We therefore developed an IL-15-driven 6 to 12 day short-term protocol for in vitro detection of HAdV-specific T cells, as revealed by known MHC class I multimers and a newly identified adenoviral CD8 T-cell epitope derived from the E1A protein for the frequent HLA-type A*02∶01 and IFN-γ. Using this novel and improved diagnostic approach we observed a correlation between adenoviral load and reconstitution of CD8(+) and CD4(+) HAdV-specific T-cells including central memory cells in HSCT-patients. Adaption of the 12-day protocol to good manufacturing practice conditions resulted in a 2.6-log (mean) expansion of HAdV-specific T-cells displaying high cytolytic activity (4-fold) compared to controls and low or absent alloreactivity. Similar protocols successfully identified and rapidly expanded CMV-, EBV-, and BKV-specific T-cells. Our approach provides a powerful clinical-grade convertible tool for rapid and cost-effective detection and enrichment of multiple virus-specific T-cells that may facilitate broad clinical application.
Conflict of interest statement
Figures
Similar articles
-
Simultaneous isolation of CD8(+) and CD4(+) T cells specific for multiple viruses for broad antiviral immune reconstitution after allogeneic stem cell transplantation.J Immunother. 2011 Apr;34(3):307-19. doi: 10.1097/CJI.0b013e318213cb90. J Immunother. 2011. PMID: 21389867
-
Safe adoptive transfer of virus-specific T-cell immunity for the treatment of systemic adenovirus infection after allogeneic stem cell transplantation.Br J Haematol. 2006 Jul;134(1):64-76. doi: 10.1111/j.1365-2141.2006.06108.x. Br J Haematol. 2006. PMID: 16803570
-
Combined CD8+ and CD4+ adenovirus hexon-specific T cells associated with viral clearance after stem cell transplantation as treatment for adenovirus infection.Haematologica. 2010 Nov;95(11):1943-51. doi: 10.3324/haematol.2010.022947. Epub 2010 Jun 18. Haematologica. 2010. PMID: 20562315 Free PMC article. Clinical Trial.
-
Clinical grade generation of hexon-specific T cells for adoptive T-cell transfer as a treatment of adenovirus infection after allogeneic stem cell transplantation.J Immunother. 2008 Feb-Mar;31(2):199-206. doi: 10.1097/CJI.0b013e31815ef862. J Immunother. 2008. PMID: 18481389
-
Rapid generation of combined CMV-specific CD4+ and CD8+ T-cell lines for adoptive transfer into recipients of allogeneic stem cell transplants.Blood. 2004 May 1;103(9):3565-72. doi: 10.1182/blood-2003-09-3056. Epub 2003 Dec 11. Blood. 2004. PMID: 14670917
Cited by
-
Adenovirus infections in immunocompetent and immunocompromised patients.Clin Microbiol Rev. 2014 Jul;27(3):441-62. doi: 10.1128/CMR.00116-13. Clin Microbiol Rev. 2014. PMID: 24982316 Free PMC article. Review.
-
Discovery of immunodominant T-cell epitopes reveals penton protein as a second immunodominant target in human adenovirus infection.J Transl Med. 2016 Oct 7;14(1):286. doi: 10.1186/s12967-016-1042-2. J Transl Med. 2016. PMID: 27717382 Free PMC article.
-
Characterization of the conserved regions of E1A protein from human adenovirus for reinforcement of cytotoxic T lymphocytes responses to the all genogroups causes ocular manifestation through an in silico approach.Iran J Microbiol. 2022 Oct;14(5):746-758. doi: 10.18502/ijm.v14i5.10971. Iran J Microbiol. 2022. PMID: 36531810 Free PMC article.
-
Human AdV-specific T cells: persisting in vitro functionality despite lethal irradiation.Bone Marrow Transplant. 2014 Jul;49(7):934-41. doi: 10.1038/bmt.2014.86. Epub 2014 Apr 28. Bone Marrow Transplant. 2014. PMID: 24777182
-
Development of a multivariable gene-expression signature targeting T-cell-mediated rejection in peripheral blood of kidney transplant recipients validated in cross-sectional and longitudinal samples.EBioMedicine. 2019 Mar;41:571-583. doi: 10.1016/j.ebiom.2019.01.060. Epub 2019 Mar 2. EBioMedicine. 2019. PMID: 30833191 Free PMC article.
References
-
- Lion T, Baumgartinger R, Watzinger F, Matthes-Martin S, Suda M, et al. (2003) Molecular monitoring of adenovirus in peripheral blood after allogeneic bone marrow transplantation permits early diagnosis of disseminated disease. Blood 102: 1114–1120. - PubMed
-
- Watcharananan SP, Kiertiburanakul S, Piyatuctsanawong W, Anurathapan U, Sungkanuparph S, et al. (2010) Cytomegalovirus, adenovirus, and polyomavirus co-infection among pediatric recipients of allogeneic stem cell transplantation: characteristics and outcome. Pediatr Transplant 14: 675–681. - PubMed
-
- George D, El-Mallawany NK, Jin Z, Geyer M, Della-Latta P, et al. (2012) Adenovirus infection in paediatric allogeneic stem cell transplantation recipients is a major independent factor for significantly increasing the risk of treatment related mortality. Br J Haematol 156: 99–108. - PubMed
-
- Schilham MW, Claas EC, van Zaane W, Heemskerk B, Vossen JM, et al. (2002) High levels of adenovirus DNA in serum correlate with fatal outcome of adenovirus infection in children after allogeneic stem-cell transplantation. Clin Infect Dis 35: 526–532. - PubMed
Publication types
MeSH terms
Substances
LinkOut - more resources
Full Text Sources
Other Literature Sources
Research Materials
