. 2013 Apr 22;8(4):e60997.
doi: 10.1371/journal.pone.0060997. Print 2013.

Principal networks

Affiliations

Principal networks

Jonathan D Clayden et al. PLoS One. .

Abstract

Graph representations of brain connectivity have attracted a lot of recent interest, but existing methods for dividing such graphs into connected subnetworks have a number of limitations in the context of neuroimaging. This is an important problem because most cognitive functions would be expected to involve some but not all brain regions. In this paper we outline a simple approach for decomposing graphs, which may be based on any measure of interregional association, into coherent "principal networks". The technique is based on an eigendecomposition of the association matrix, and is closely related to principal components analysis. We demonstrate the technique using cortical thickness and diffusion tractography data, showing that the subnetworks which emerge are stable, meaningful and reproducible. Graph-theoretic measures of network cost and efficiency may be calculated separately for each principal network. Unlike some other approaches, all available connectivity information is taken into account, and vertices may appear in none or several of the subnetworks. Subject-by-subject "scores" for each principal network may also be obtained, under certain circumstances, and related to demographic or cognitive variables of interest.


Conflict of interest statement

Competing Interests: The authors have declared that no competing interests exist.

Figures

Figure 1
Figure 1. Visualisation of the full association matrix derived from all cortical thickness data.
The matrix is shown twice, with the gyral regions ordered either numerically by index (left), or by their loading in the first principal network (right). The scale is based on Pearson's correlation coefficient between regions, across all participants.
Figure 2
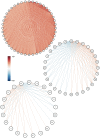
Figure 2. First (top), second (middle) and third (bottom) principal networks, based on all cortical thickness data.
Only vertices and edges above the appropriate loading and weight thresholds are shown. The vertices are laid out regularly in a circle for visual clarity, and ordered by their loading in the appropriate PN.
Figure 3
Figure 3. Result of partitioning the thresholded cortical thickness association matrix, using a well-established modularity maximisation algorithm.
Two groups of vertices, of equal size, emerge. These are delimited by horizontal and vertical black lines. Since this algorithm does not identify an ordering for vertices, they are ordered numerically within each group.
Figure 4
Figure 4. Dendrogram showing the results of hierarchical clustering applied to the cortical thickness data, using (1-correlation) as the distance measure.
“Height”, on the y-axis, refers to the maximum distance between vertices in each pair of clusters. The coloured lines at the bottom of the figure indicate which vertices appear in each of the three main PNs.
Figure 5
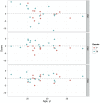
Figure 5. Scores for each of the three major principal networks based on cortical thickness, plotted against age.
Note that the scores for each PN sum to zero.
Figure 6
Figure 6. First principal network derived from diffusion data in each of two repeat scans of two subjects.
The location of each vertex is based on the original segmentation, using the spatial median of the corresponding region. All four graphs emphasise the strong interconnections between subregions of cingulate cortex.
Figure 7
Figure 7. Eigenvalues of the first 20 principal networks derived from each subject's first diffusion MRI data set.
The pattern of fall-off is very similar from subject to subject, indicating consistency in subnetwork weights across our cohort.
Figure 8
Figure 8. Illustration of the principal networks approach using a simple graph with five vertices (A).
The first and second principal networks (B,C) capture the two canonical subnetworks in the graph.

References

    1. Bullmore E, Sporns O (2009) Complex brain networks: graph theoretical analysis of structural and functional systems. Nature Reviews Neuroscience 10: 186–198. - PubMed
    1. Euler L (1741) Solutio problematis ad geometriam situs pertinentis. Commentarii academiae scientiarum imperialis Petropolitanae 8: 128–140.
    1. Bernhardt BC, Chen Z, He Y, Evans AC, Bernasconi N (2011) Graph-theoretical analysis reveals disrupted small-world organization of cortical thickness correlation networks in temporal lobe epilepsy. Cerebral Cortex 21: 2147–2157. - PubMed
    1. WenW ZhuW, He Y, Kochan NA, Reppermund S, et al. (2011) Discrete neuroanatomical networks are associated with specific cognitive abilities in old age. The Journal of Neuroscience 31: 1204–1212. - PMC - PubMed
    1. Kaiser M, Varier S (2011) Evolution and development of brain networks: From Caenorhabditis elegans to Homo sapiens. Network: Computation in Neural Systems 22: 143–147. - PubMed

Publication types

LinkOut - more resources