. 2013 Apr 22;8(4):e61948.
doi: 10.1371/journal.pone.0061948. Print 2013.

Targeted deletion of the ERK5 MAP kinase impairs neuronal differentiation, migration, and survival during adult neurogenesis in the olfactory bulb

Affiliations

Targeted deletion of the ERK5 MAP kinase impairs neuronal differentiation, migration, and survival during adult neurogenesis in the olfactory bulb

Tan Li et al. PLoS One. .

Abstract

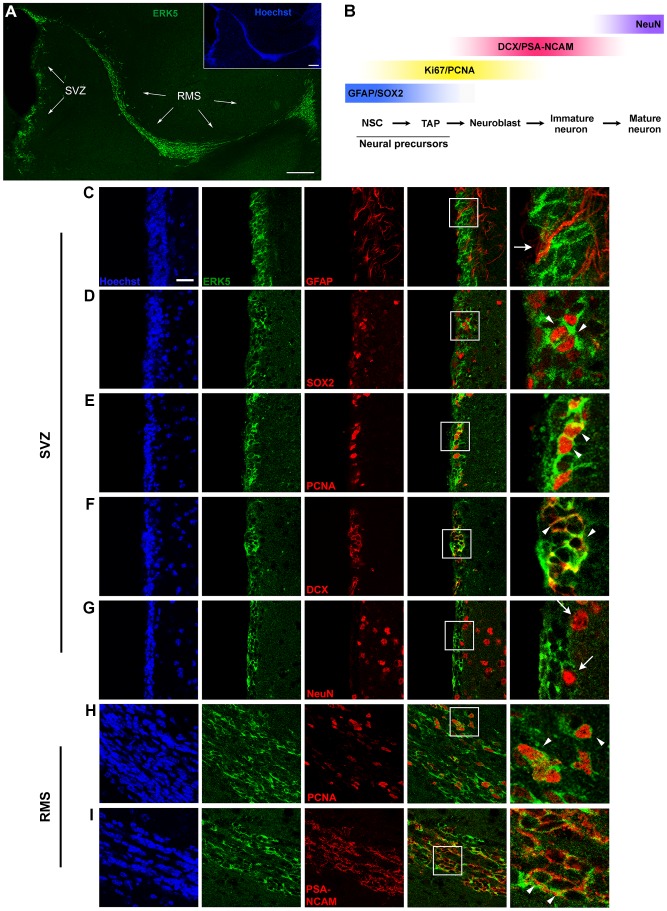
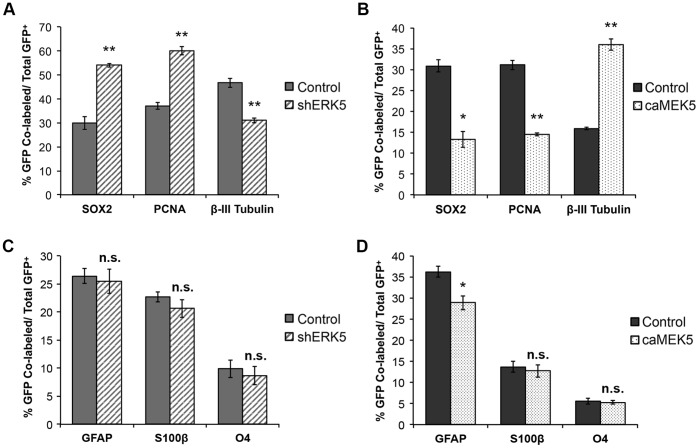
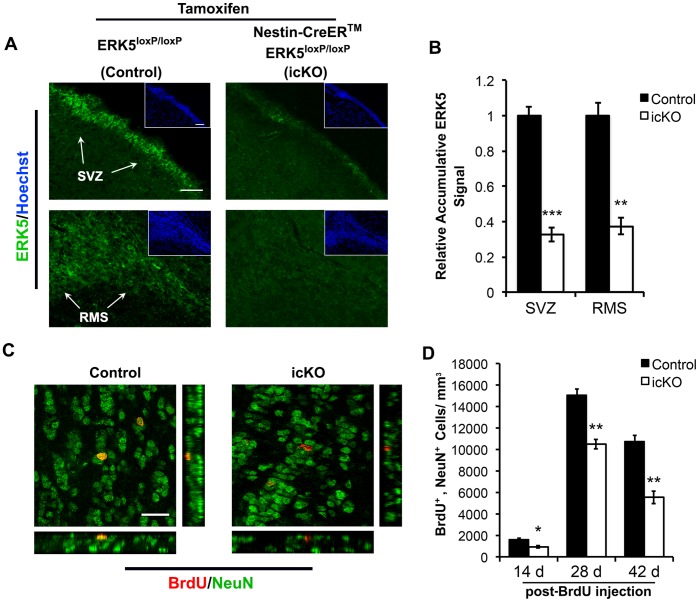
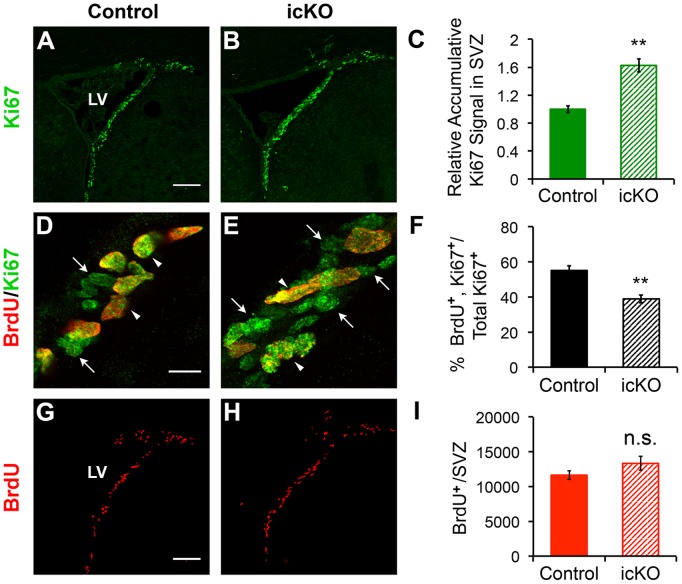
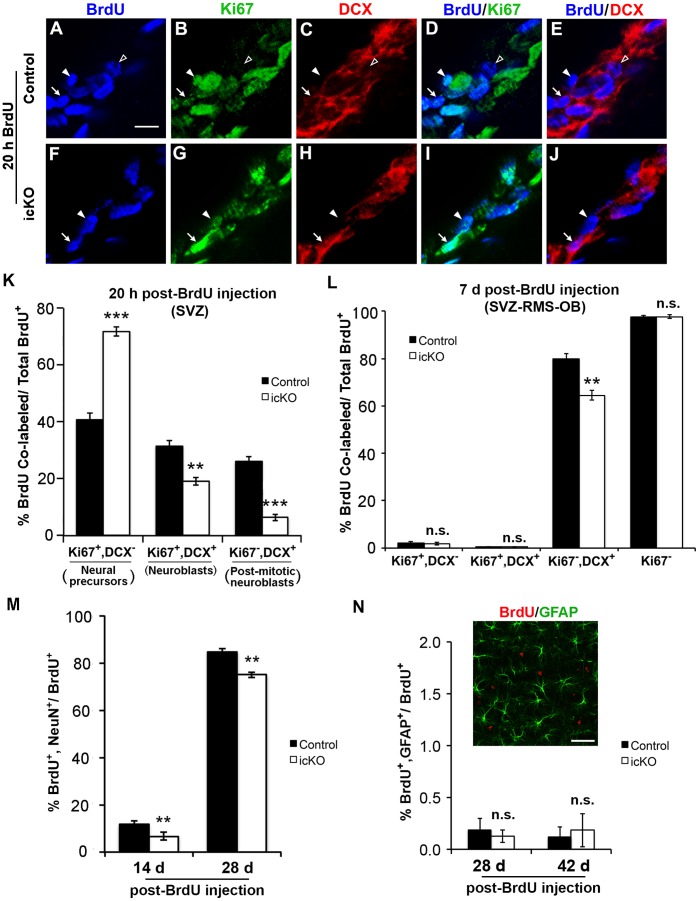
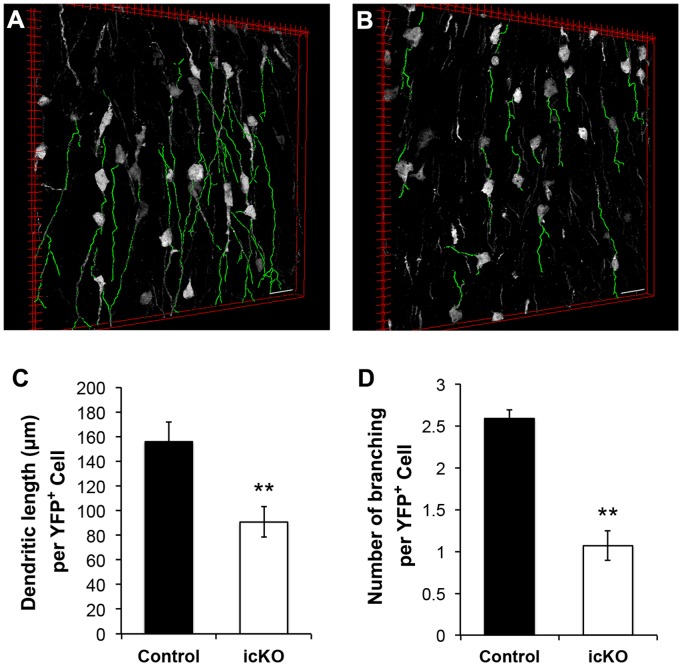
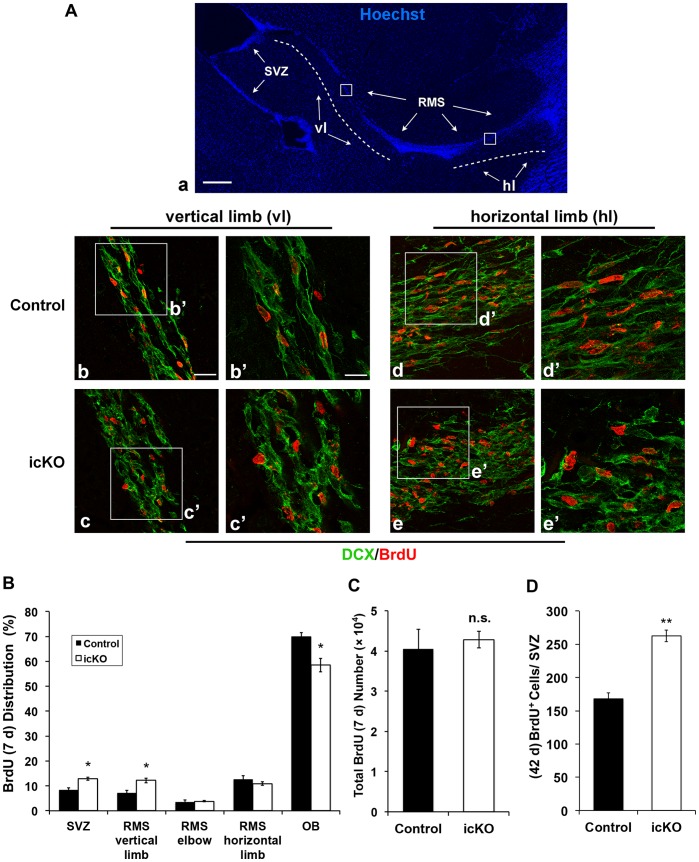
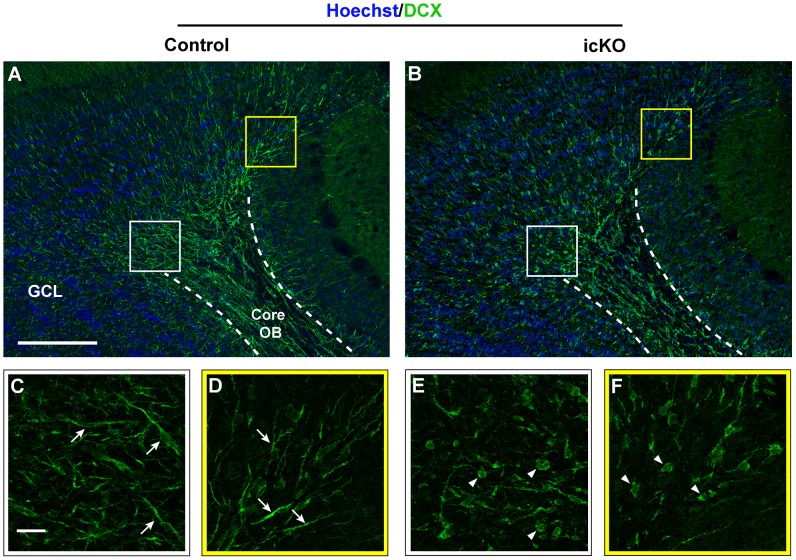
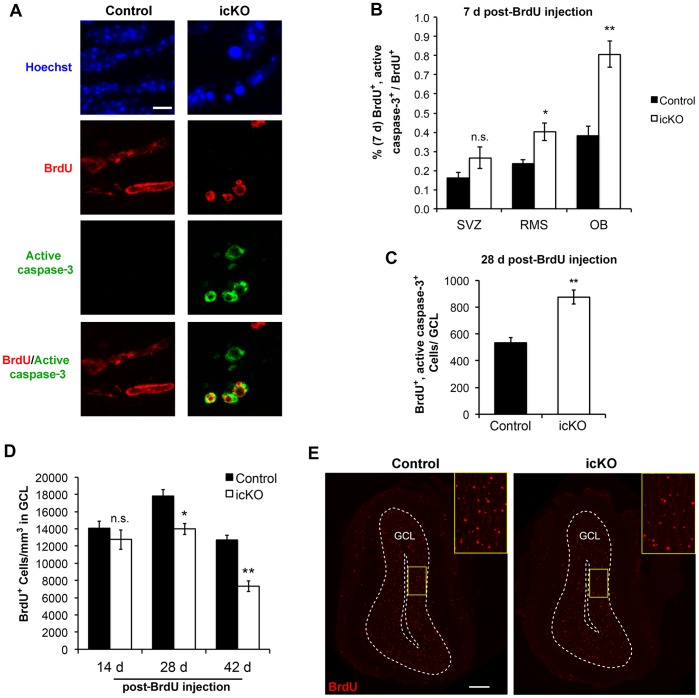
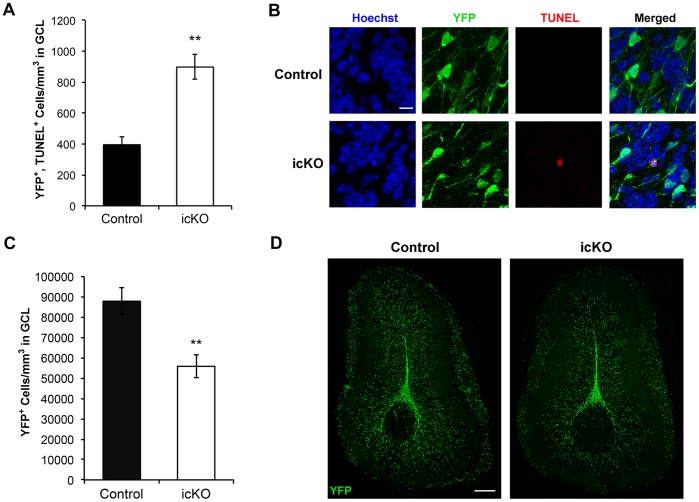
Recent studies have led to the exciting idea that adult-born neurons in the olfactory bulb (OB) may be critical for complex forms of olfactory behavior in mice. However, signaling mechanisms regulating adult OB neurogenesis are not well defined. We recently reported that extracellular signal-regulated kinase (ERK) 5, a MAP kinase, is specifically expressed in neurogenic regions within the adult brain. This pattern of expression suggests a role for ERK5 in the regulation of adult OB neurogenesis. Indeed, we previously reported that conditional deletion of erk5 in adult neurogenic regions impairs several forms of olfactory behavior in mice. Thus, it is important to understand how ERK5 regulates adult neurogenesis in the OB. Here we present evidence that shRNA suppression of ERK5 in adult neural stem/progenitor cells isolated from the subventricular zone (SVZ) reduces neurogenesis in culture. By contrast, ectopic activation of endogenous ERK5 signaling via expression of constitutive active MEK5, an upstream activating kinase for ERK5, stimulates neurogenesis. Furthermore, inducible and conditional deletion of erk5 specifically in the neurogenic regions of the adult mouse brain interferes with cell cycle exit of neuroblasts, impairs chain migration along the rostral migratory stream and radial migration into the OB. It also inhibits neuronal differentiation and survival. These data suggest that ERK5 regulates multiple aspects of adult OB neurogenesis and provide new insights concerning signaling mechanisms governing adult neurogenesis in the SVZ-OB axis.


Conflict of interest statement

Competing Interests: The authors have declared that no competing interests exist.

Figures

Figure 1
Figure 1. Characterization of ERK5 expression in the SVZ-RMS axis.
(A) ERK5 (green) was expressed throughout the SVZ-RMS axis in sagittal sections. Nuclei (blue) were visualized by Hoechst staining. Scale bar represents 250 µm. (B) Schematic diagram of adult OB neurogenesis and markers used in in vivo studies. NSC, neural stem cell; TAP, transit-amplifying progenitor. (C-I) Representative confocal images of coronal (SVZ) and sagittal (RMS) brain sections, co-immunostained for ERK5 (green) and GFAP (C), SOX2 (D), PCNA (E), doublecortin (DCX) (F), or NeuN (G) in the SVZ, and PCNA (H), or PSA-NCAM (I) in the RMS. The panels in the far right column represent the enlarged boxed areas respective to their left panels. Scale bar in (C) represents 25 µm and applies to all panels in (C-I), except the right column. Arrowheads point to co-labeled cells, while arrows point to cells that do not express ERK5.
Figure 2
Figure 2. ERK5 signaling regulates neurogenesis of SVZ-derived aNPCs in culture.
(A) ERK5 signaling is necessary for promoting spontaneous neurogenesis. aNPCs were infected with non-specific shRNA control retroviral vector (shNS) or shRNA to ERK5 retrovirus (shERK5). Both retroviral vectors encode an eGFP marker protein under a bicistronic promoter . One day after virus infection, cells were incubated in EGF and bFGF-free medium for 5 d to allow spontaneous differentiation. The percentage of GFP+ cells that were also SOX2+, PCNA+, or β-III Tubulin+ was quantified. (B) Activation of endogenous ERK5 signaling is sufficient to promote neurogenesis. aNPCs were infected with control retroviral vector expressing eGFP only or expressing caMEK5-IRES-eGFP. One day after virus infection, cells were washed and then placed in fresh regular medium containing mitogenic EGF and bFGF for 5 d. (C) ERK5 knockdown does not affect glial differentiation. GFAP, a marker for astrocytes as well as SVZ stem cells; S100β, a marker for astrocytes; O4, an oligodendrocyte marker. (D) Effect of ERK5 activation on cells expressing GFAP, S100β, and O4. Over 200 virus-infected cells (GFP+) from each sample were analyzed and quantified. Data are mean ± SEM from three independent experiments (n = 3). *, p<0.05; **, p<0.01.
Figure 3
Figure 3. Inducible and conditional knockout (icKO) of ERK5 decreases adult OB neurogenesis.
(A) Representative images of ERK5 immunostaining (green) in the SVZ and RMS in control and ERK5 icKO mice. Scale bar represents 50 µm. Insets were Hoechst staining of the sections. (B) Quantification of ERK5 staining intensity in the SVZ and RMS, measured by ImageJ. Data represent accumulative signal relative to control. (C) Representative confocal images of BrdU (red) and NeuN (green) in the OB of control and icKO mice at 28 d post-BrdU injection. Scale bar in (C) represents 20 µm. (D) Quantification of the density of BrdU and NeuN co-labeled cells in the GCL of the OB at 14, 28 and 42 days post-BrdU injection. n  = 4 individual mouse brains and olfactory bulbs per group. *, p<0.05; **, p<0.01; ***, p<0.001.
Figure 4
Figure 4. Effect of erk5 deletion on proliferation in the SVZ.
Brain sections were subjected to immunohistochemistry and quantification for Ki67 and BrdU staining. (A-B) Representative images of Ki67 (green) staining in the SVZ of control or ERK5 icKO mice. Scale bar represents 100 µm. (C) Relative intensity of Ki67 staining in the SVZ was measured by ImageJ. (D-E) Representative confocal images of Ki67 (green) and BrdU (red) co-staining in the SVZ at 2 h post-BrdU injection. Arrowheads point to co-labeled cells; arrows point to Ki67+ but BrdU- cells. Scale bar represent 10 µm. (F) Percentage of Ki67+ cells in the SVZ that are also BrdU+. (G-H) Representative images of BrdU (red) staining in the SVZ at 2 h post-BrdU injection. Scale bar represents 100 µm. (I) Total number of BrdU+ cells in the SVZ at 2 h after BrdU injection. n  = 4 individual mouse brains and olfactory bulbs per group. n.s. not significant; *, p<0.05; **, p<0.01.
Figure 5
Figure 5. ERK5 deletion inhibits neuronal differentiation in vivo without affecting the production of astrocytes.
(A–J) Representative confocal images of immunostaining for BrdU (pseudo-colored blue), Ki67 (green), and DCX (red) in the SVZ at 20 h post-BrdU injection. Filled arrowheads point to neural precursors (BrdU+, Ki67+, DCX-); arrows point to neuroblasts (BrdU+, Ki67+, DCX+); open arrowheads mark a post-mitotic neuroblast (BrdU+, Ki67, DCX+). Scale bar represents 10 µm. (K) Quantification of the data from panels A-J as the percentages of neural precursors, neuroblasts, and post-mitotic neuroblasts in the BrdU+ population in the SVZ. (L) The percentage of BrdU+ cells that express Ki67 and/or DCX at 7 d post-BrdU injection along the SVZ-RMS-OB axis. (M) The percentage of BrdU+ population that express NeuN at 14 d or 28 d post-BrdU injection in the OB. (N) Representative confocal image of GFAP (green) and BrdU (red) co-staining in the OB at 28 d post-BrdU injection. Scale bar represents 40 µm. The graph shows the percentage of BrdU+ population that express GFAP at 28 d or 42 d post-BrdU injection in the OB. n  = 4 individual mouse brains and olfactory bulbs per group. n.s. not significant; **, p<0.01; ***, p<0.001.
Figure 6
Figure 6. ERK5 deletion inhibits neuronal maturation in the OB.
(A–B) Representative 3-D images of YFP+ cells in the OB. The OB sections were cut at 20 µm. Dendrites were highlighted by green color using Simple Neurite Tracer. Images were created by the 3D viewer of ImageJ. Scale bars represent 25 µm. (C) Average dendritic length of YFP+ cells in the OB was measured. (D) Quantification of the average number of dendritic branching of YFP+ cells. n  = 3 individual mouse brains and olfactory bulbs per group. **, p<0.01.
Figure 7
Figure 7. ERK5 icKO impairs chain migration of newborn cells in the RMS.
(A) Immunohistochemistry staining of the RMS with DCX (green) and BrdU (red), 7 d post-BrdU injection. Hoechst staining (Blue) was used to visualize the SVZ-RMS-OB pathway in (a). Dash lines in (a) show the vertical limb (vl) and horizontal limb (hl) of the RMS. Scale bars in (a) represents 250 µm, in (b) represents 25 µm and applies to (b-e), in b’ represents 12.5 µm and applies to (b’-e’). Squares in (b-e) were enlarged in (b’-e’), respectively. (B) Quantification of regional BrdU+ cell distribution along the SVZ-RMS-OB pathway at 7 d post-BrdU injection. (C) Quantification of total BrdU+ cells along the SVZ-RMS-OB pathway at 7 d post-BrdU injection. (D) Quantification of BrdU+ cells in the SVZ at 42 d post-BrdU injection. n  = 4 individual mouse brains and olfactory bulbs per group. n.s. not significant; *, p<0.05; **, p<0.01.
Figure 8
Figure 8. ERK5 icKO impairs radial migration of newborn cells in the OB.
Sagittal sections from control and ERK5 icKO brains were stained for Hoechst (blue) and DCX (green), to examine the morphology of newborn cells radially migrating away from the core of the OB to the GCL. Scale bar in (A) represents 250 µm and applies to (B). White and yellow squares in (A, B) were closely analyzed by confocal stacks and shown in (C-F), respectively. Scale bar in (C) represents 25 µm and applies to (C-F). Arrows point to elongated DCX+ cells with leading processes. Arrowheads point to round DCX+ cells lacking leading processes.
Figure 9
Figure 9. ERK5 icKO inhibits survival of newborn cells in the OB.
(A) Representative immunostaining of active caspase-3 (green) and BrdU (red) at 7 d post-BrdU injection in the OB. Hoechst stained nuclei (blue). Scale bar represents 5 µm and applies to all panels. (B) Quantification of active caspase-3+ cells in BrdU+ cell population at 7 d post-BrdU injection. (C) Quantification of total active caspase-3+ and BrdU+ cells at 28 d post-BrdU injection. (D) Quantification of BrdU+ cell density in the GCL of the OB, at 14, 28 and 42 d post-BrdU injection. (E) Representative images of BrdU staining (red) at 28 d post-BrdU injection. The yellow rectangles outline the enlarged areas, shown in the insets, for clearer visualization. Scale bar represents 250 µm. n  = 4 individual olfactory bulbs per group. n.s. not significant; *, p<0.05; **, p<0.01.
Figure 10
Figure 10. ERK5 icKO inhibits survival of newborn cells in the OB of YFP reporter mice.
(A) Quantification of the density of YFP+ cells in the GCL of control (Nestin-CreER™/R26-YFPloxP/loxP) and ERK5 icKO mice (Nestin-CreER™/ERK5loxP/loxP/R26-YFPloxP/loxP) that are also TUNEL+, at 32 d after the last dose of tamoxifen. (B) Representative images of Hoechst (blue), YFP (green), and TUNEL (red) staining in the GCL. Scale bar represents 10 µm and applies to all images. (C) Quantification of YFP+ cell density in the GCL at 32 d after the last dose of tamoxifen. (D) Representative images of YFP immunostaining in the OB. Scale bar represents 250 µm and applies to both images. n  = 3 individual olfactory bulbs per group. **, p<0.01.

Similar articles

Cited by

References

    1. Altman J (1969) Autoradiographic and histological studies of postnatal neurogenesis. IV. Cell proliferation and migration in the anterior forebrain, with special reference to persisting neurogenesis in the olfactory bulb. J Comp Neurol 137: 433–457. - PubMed
    1. Ming GL, Song H (2011) Adult neurogenesis in the mammalian brain: significant answers and significant questions. Neuron 70: 687–702. - PMC - PubMed
    1. Doetsch F, Caille I, Lim DA, Garcia-Verdugo JM, Alvarez-Buylla A (1999) Subventricular zone astrocytes are neural stem cells in the adult mammalian brain. Cell 97: 703–716. - PubMed
    1. Gage FH (2000) Mammalian neural stem cells. Science 287: 1433–1438. - PubMed
    1. Whitman MC, Greer CA (2009) Adult neurogenesis and the olfactory system. Prog Neurobiol 89: 162–175. - PMC - PubMed

Publication types

Substances

LinkOut - more resources