. 2013 Apr 22;8(4):e62410.
doi: 10.1371/journal.pone.0062410. Print 2013.

Evidence that adrenergic ventrolateral medullary cells are activated whereas precerebellar lateral reticular nucleus neurons are suppressed during REM sleep

Affiliations

Evidence that adrenergic ventrolateral medullary cells are activated whereas precerebellar lateral reticular nucleus neurons are suppressed during REM sleep

Georg M Stettner et al. PLoS One. .

Abstract

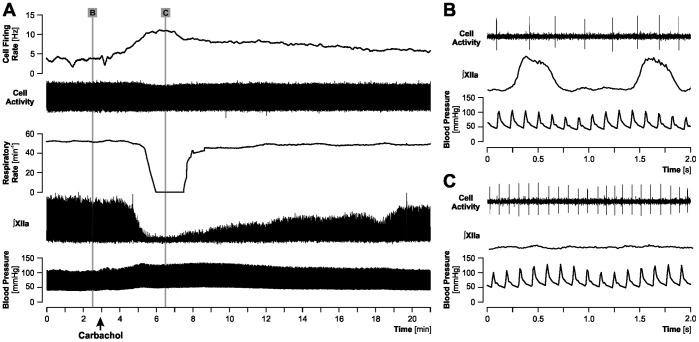
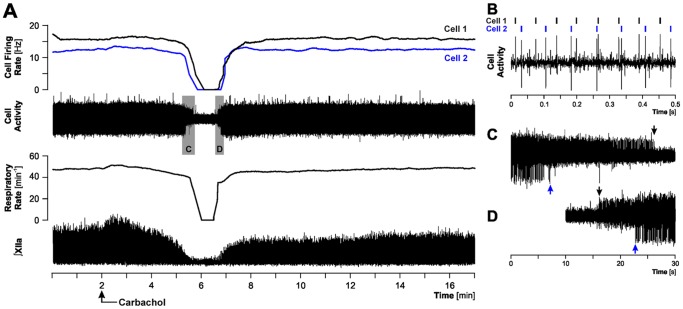
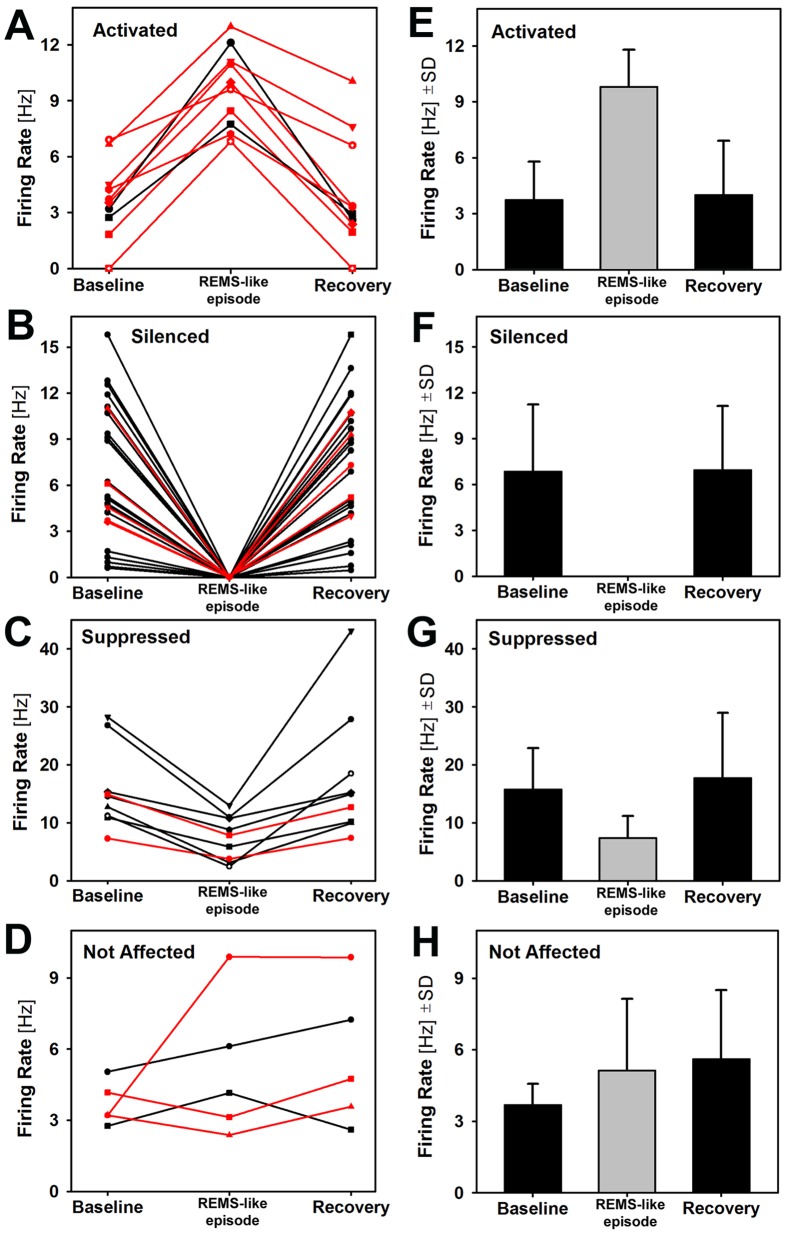
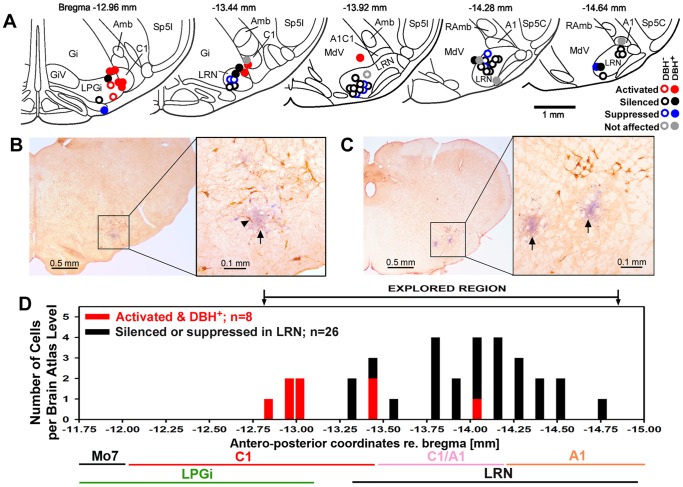
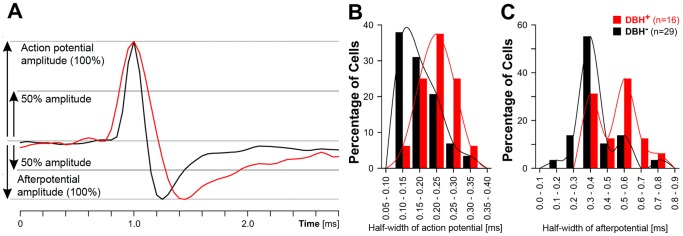
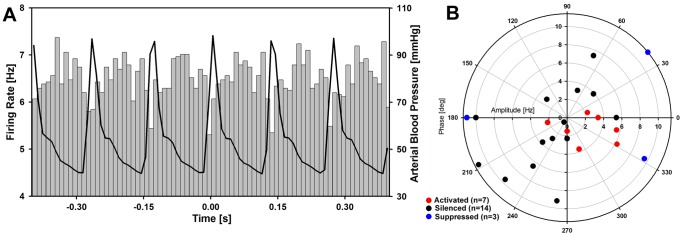
Rapid eye movement sleep (REMS) is generated in the brainstem by a distributed network of neurochemically distinct neurons. In the pons, the main subtypes are cholinergic and glutamatergic REMS-on cells and aminergic REMS-off cells. Pontine REMS-on cells send axons to the ventrolateral medulla (VLM), but little is known about REMS-related activity of VLM cells. In urethane-anesthetized rats, dorsomedial pontine injections of carbachol trigger REMS-like episodes that include cortical and hippocampal activation and suppression of motoneuronal activity; the episodes last 4-8 min and can be elicited repeatedly. We used this model to determine whether VLM catecholaminergic cells are silenced during REMS, as is typical of most aminergic neurons studied to date, and to investigate other REMS-related cells in this region. In 18 anesthetized, paralyzed and artificially ventilated rats, we obtained extracellular recordings from VLM cells when REMS-like episodes were elicited by pontine carbachol injections (10 mM, 10 nl). One major group were the cells that were activated during the episodes (n = 10). Their baseline firing rate of 3.7±2.1 (SD) Hz increased to 9.7±2.1 Hz. Most were found in the adrenergic C1 region and at sites located less than 50 µm from dopamine β-hydroxylase-positive (DBH(+)) neurons. Another major group were the silenced or suppressed cells (n = 35). Most were localized in the lateral reticular nucleus (LRN) and distantly from any DBH(+) cells. Their baseline firing rates were 6.8±4.4 Hz and 15.8±7.1 Hz, respectively, with the activity of the latter reduced to 7.4±3.8 Hz. We conclude that, in contrast to the pontine noradrenergic cells that are silenced during REMS, medullary adrenergic C1 neurons, many of which drive the sympathetic output, are activated. Our data also show that afferent input transmitted to the cerebellum through the LRN is attenuated during REMS. This may distort the spatial representation of body position during REMS.


Conflict of interest statement

Competing Interests: The authors have declared that no competing interests exist.

Figures

Figure 1
Figure 1. Example of a cell that was activated during a REMS-like episode.
A: a 21 min-long record covering a period of baseline activity, carbachol-triggered REMS-like episode and recovery. The REMS-like episode is marked by the steep decline of integrated XII nerve activity (∫XIIa), ultimately leading to a transient disappearance of its inspiratory-modulated bursts, with a concurrent decline of the central respiratory rate and an increase of arterial blood pressure. The cell firing rate is more than doubled at the peak of the effect. Subsequently, both XII nerve activity and arterial blood pressure gradually recover, roughly in parallel to the decline of the firing rate of the cell. Carbachol was injected into the dorsomedial pontine tegmentum at the arrow (10 nl, 10 mM). B and C: expanded portions of the main record during the baseline period and at the peak of the effect, as indicated by the grey lines in A. The records show individual action potentials together with details of integrated XII nerve activity and blood pressure waveforms.
Figure 2
Figure 2. Example of a simultaneous recording from two cells that were silenced during a REMS-like episode.
A: a 17 min-long record, with the period of REMS-like episode marked by a profound depression of XII nerve activity (∫XIIa) and a reduction of central respiratory rate that included a transient arrest of the central respiratory rhythm. During the episode, both cells are transiently silenced. Carbachol was injected into the dorsomedial pontine tegmentum at the arrow (10 nl, 10 mM). B: a segment of baseline activity at an expanded time scale showing different amplitudes and configurations of the action potentials generated by the two cells. C and D: expanded portions of the main record covering the periods when the two cells became silent and then resumed activity, as indicated by the grey areas superimposed on the cell activity trace in A. Arrows of the corresponding colors mark the offsets and onsets of firing for cells 1 and 2, as designated in A and B. The cell with a smaller action potential (cell 1) was silenced later than the larger cell (cell 2) at the beginning of the REMS-like episode and then resumed firing earlier than the cell with the larger action potential during the recovery.
Figure 3
Figure 3. Individual and average firing rates within each cell category under the baseline conditions, during the REMS-like episodes, and following recovery.
A–D: Firing rates of each of the 50 studied cells measured before, during and after REMS-like episode grouped by their different behaviors during the episode. The cells recorded at sites located closer than 50 µm from one or more DBH-positive (DBH+) neurons are marked by red lines. The lines representing firing rates of different cells end with different symbols to allow for tracking of each cell firing rate across the three conditions. The percentage of cells recorded near DBH+ neurons was significantly higher among the activated cells (80%) than among either the silenced (19%) or suppressed (22%) cells (P = 0.001 and P = 0.023 by Fisher-Exact test, with the odds ratios of 16 and 14, respectively). E-H: Mean firing rates before, during and after the REMS-like episodes for each of the four groups of cells. On the average, the firing rate changes between the baseline and maximal effect during the REMS-like episode were statistically significant for each of the affected groups, and the firing rate after the episode was not different from that during the baseline period. Activated cells had lower baseline firing rates than the silenced cells (P<0.038, unpaired t-test). The baseline firing rate of the latter was about twice lower than that of the suppressed cells (6.8±4.4 Hz vs. 15.8±7.1 Hz, P<0.0001), suggesting that the baseline firing rate determined whether a cell was silenced or only suppressed during the REMS-like episode.
Figure 4
Figure 4. Cell behavior during the REMS-like episodes was related to the anatomical location of the recording site and its proximity to DBH-positive (DBH+) neurons.
A: distribution of all recording sites superimposed onto a series of standard medullary sections from a rat brain atlas . Different symbols indicate activated, silenced, suppressed and not affected cells and mark their relative proximity to one or more DBH+ neurons. Most activated cells (8 out of 10) were found adjacent to DBH+ cells in the C1 region, and the remaining 2 in the LPGi region. Most of the silenced or suppressed cells were located within the LRN (26 out of 35). The remaining 14 cells were a mixed group; some located near the edges of the LRN may have still belonged to the nucleus and some could be spontaneously active cells of the A1 group or other reticular formation neurons that became silenced or suppressed during REMS-like episodes. B and C: examples of marked recording sites (arrows) in sections immunohistochemically labeled for DBH. The recording site in B was localized in the rostral part of the explored VLM region and within less than 50 µm from several DBH+ neurons (arrowhead points to a DBH-labeled cell located closest to the center of the recording site marked by Pontamine blue deposit). The two recording sites in C were localized more caudally, within or near the LRN, and clearly away from more dorsally located DBH+ neurons (noradrenergic A1 group). D: distribution of the activated, silenced and suppressed cells, as assigned to one of the 17 different antero-posterior levels represented in the rat brain atlas that we used as reference . The lines under the abscissa mark the levels corresponding to the C1, A1/C1 and LPGi regions and the LRN, as marked in the same atlas. The diagram shows the antero-posterio range of the VLM that we explored and its rostral extension up to the facial motor nucleus (Mo7) that contains the rostral part of the adrenergic C1 group but was not explored in our study. Abbreviations: Amb - nucleus ambiguous; Gi – gigantocellular reticular region; GiV – gigantocellular ventral reticular region; MdV – ventral medullary reticular region; RAmb - retroambiguus nucleus; Sp5C – spinal trigeminal nucleus, caudal division; Sp5I - spinal trigeminal nucleus, interpolar division.
Figure 5
Figure 5. Cells recorded near DBH-positive (DBH+) neurons had significantly longer action potentials and afterpotentials than those recorded at a distance from DBH+ cells.
A: the scheme explaining how the half-widths of action potentials and afterpotentials were measured. Two spike waveforms are superimposed, one typical of a cell with a fast action potential and another for a cell with a slow action potential. The histograms in B and C show that both the action potentials and afterpotentials had longer half-widths for the cells recorded at sites containing DBH+ neurons than for the cells located at a distance from such sites. Since the majority of cells that were activated were found in the rostral part of the explored region of the VLM and adjacent to DBH+ neurons, the spike duration data support the conclusion that most of the cells activated during REMS-like episodes were the adrenergic cells of the C1 group.
Figure 6
Figure 6. Cardiac modulation was detected in most cells activated during REMS-like episodes and in about a half of those that were silenced or suppressed.
A: example of a histogram of cell firing rate triggered from the peak of arterial blood pressure waveform. The concurrently averaged blood pressure trace is superimposed over the histogram of cell firing rate. The cell was activated during the REMS-like episode and was recorded at a site containing DBH+ neurons (amplitude of cardiac modulation: 1.6 Hz, angular phase of the lowest firing rate relative to the peak of arterial blood pressure: +14 deg). B: polar diagram illustrating the distribution of amplitudes and phases of cardiac modulation of all cells in which such modulation was detected (7 out of 9 activated cells, 14 out of 24 silenced cells, and 3 out of 9 suppressed cells). Notably, for all 5 cells that were activated during the REMS-like episodes and recorded at sites containing DBH+ neurons, the angular phase of the minimum of their firing rate was close to the peak of arterial blood pressure (red symbols in and near the lower right quadrant), whereas the silenced and suppressed cells recorded from the LRN and the two activated cells that were recorded in the LPGi region had widely scattered phase angles. This is consistent with the first group being inhibited by stimulation of arterial baroreceptors and the other cells being affected by pulse pressure through more complex pathways.

Similar articles

Cited by

References

    1. Aserinsky E, Kleitman N (1953) Regularly occurring periods of eye motility, and concomitant phenomena, during sleep. Science 118: 273–274. - PubMed
    1. Siegel JM (2001) The REM sleep-memory consolidation hypothesis. Science 294: 1058–1063. - PMC - PubMed
    1. Born J, Wilhelm I (2012) System consolidation of memory during sleep. Psychol Res 76: 192–203. - PMC - PubMed
    1. Rolls A, Colas D, Adamantidis A, Carter M, Lanre-Amos T, et al. (2011) Optogenetic disruption of sleep continuity impairs memory consolidation. Proc Natl Acad Sci USA 108: 13305–13310. - PMC - PubMed
    1. Lai YY, Siegel JM (2003) Physiological and anatomical link between Parkinson-like disease and REM sleep behavior disorder. Mol Neurobiol 27: 137–152. - PMC - PubMed

Publication types

LinkOut - more resources