. 1975 May 25;250(10):4007-21.

High resolution two-dimensional electrophoresis of proteins

High resolution two-dimensional electrophoresis of proteins

P H O'Farrell. J Biol Chem. .

Abstract

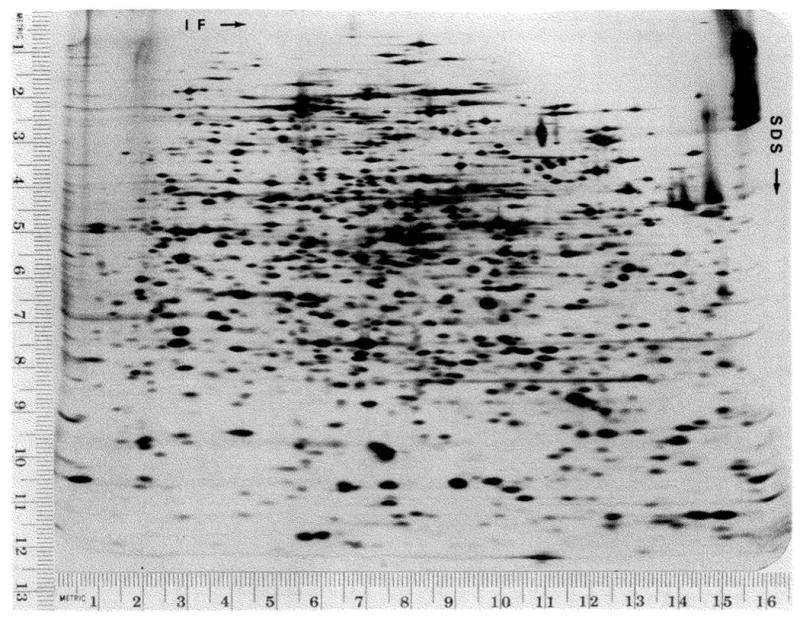
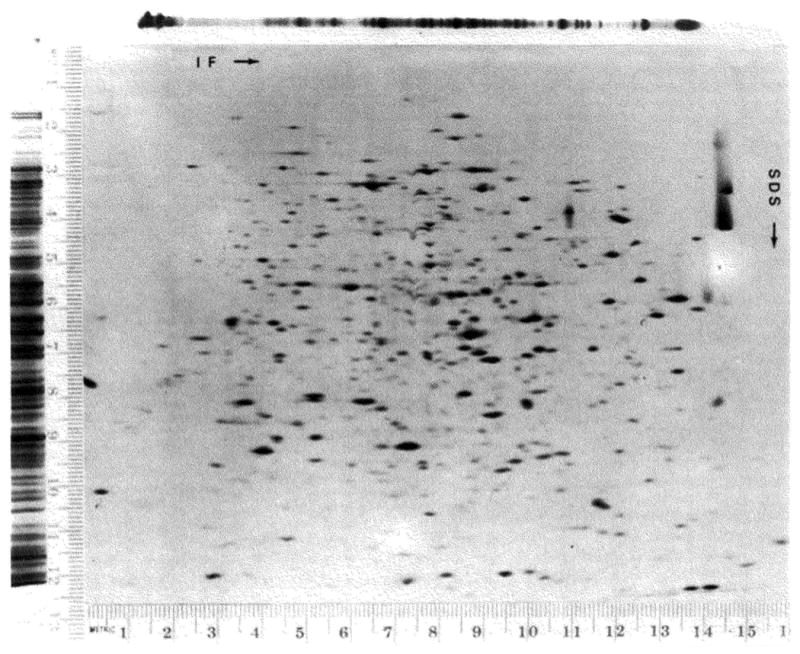
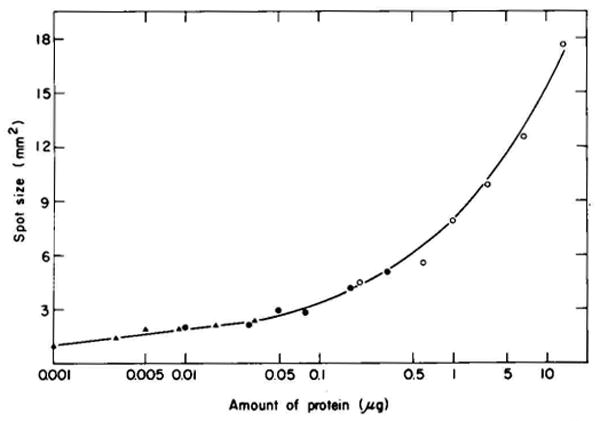
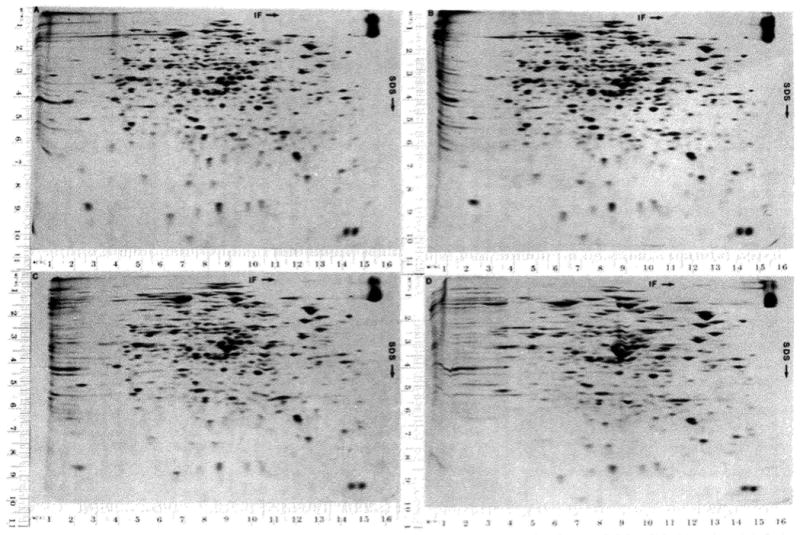
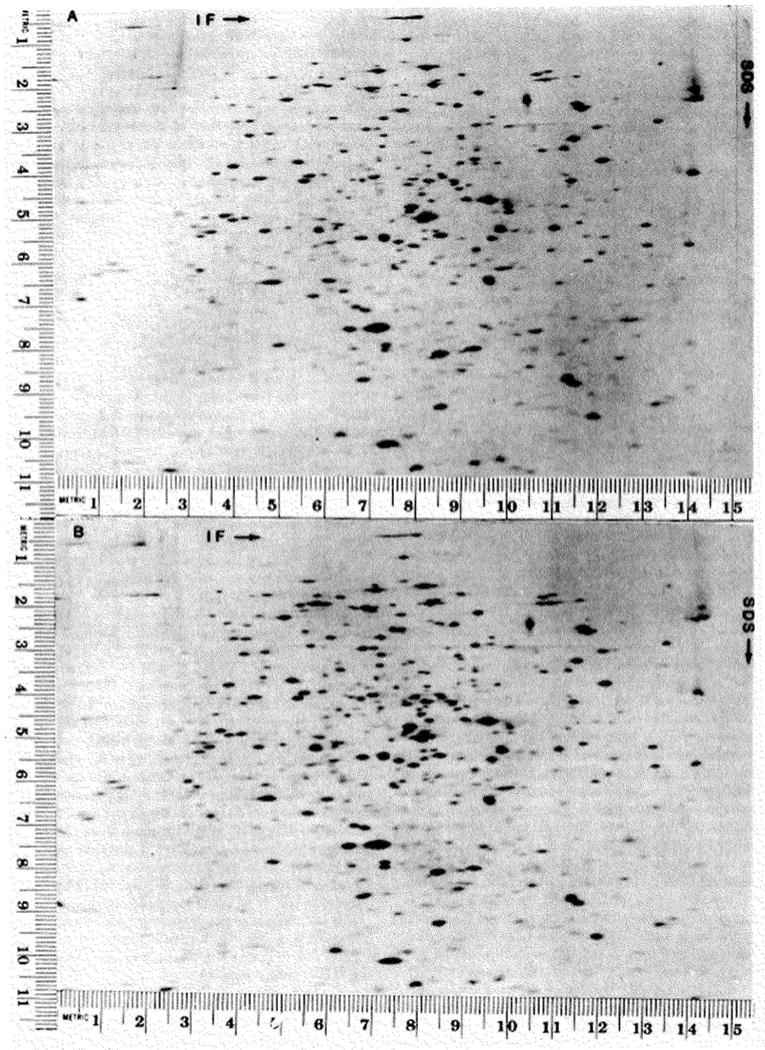
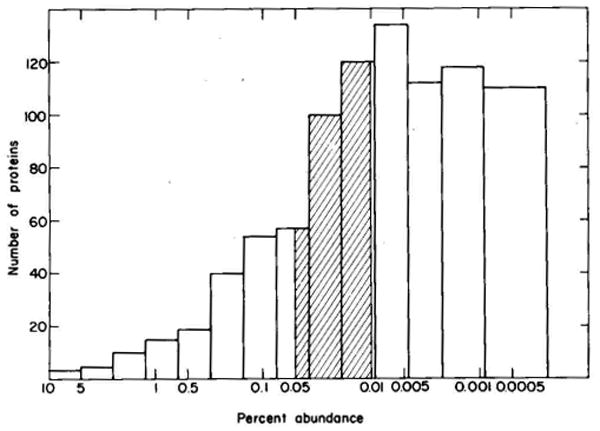
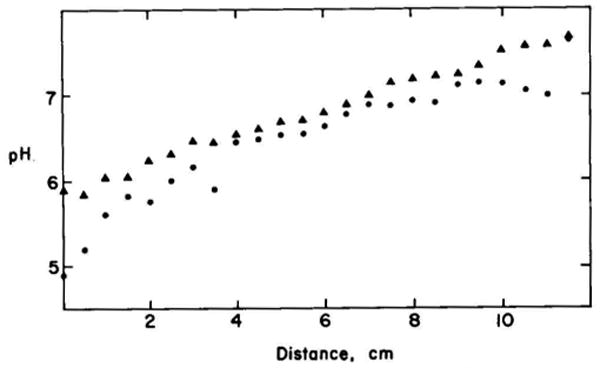
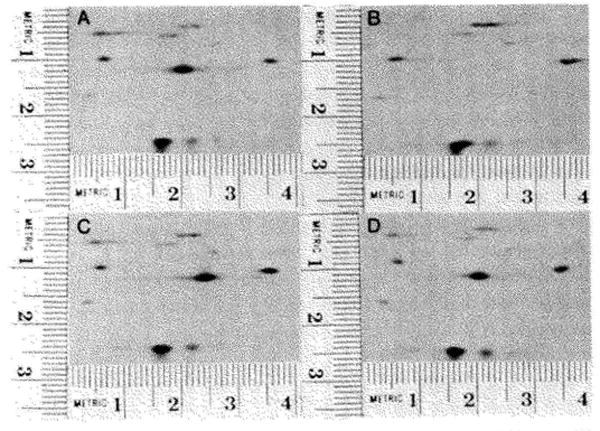
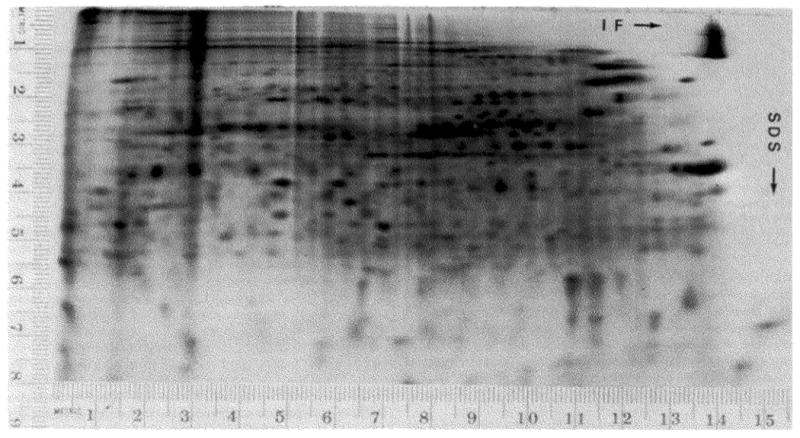
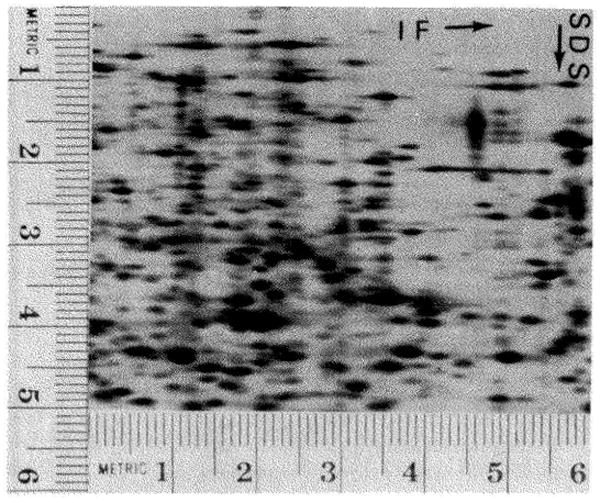
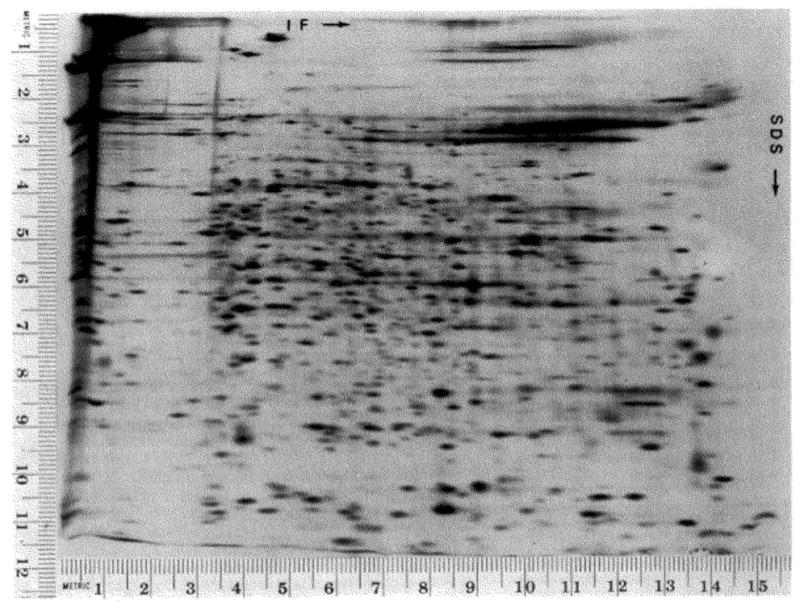
A technique has been developed for the separation of proteins by two-dimensional polyacrylamide gel electrophoresis. Due to its resolution and sensitivity, this technique is a powerful tool for the analysis and detection of proteins from complex biological sources. Proteins are separated according to isoelectric point by isoelectric focusing in the first dimension, and according to molecular weight by sodium dodecyl sulfate electrophoresis in the second dimension. Since these two parameters are unrelated, it is possible to obtain an almost uniform distribution of protein spots across a two-diminsional gel. This technique has resolved 1100 different components from Escherichia coli and should be capable of resolving a maximum of 5000 proteins. A protein containing as little as one disintegration per min of either 14C or 35S can be detected by autoradiography. A protein which constitutes 10 minus 4 to 10 minus 5% of the total protein can be detected and quantified by autoradiography. The reproducibility of the separation is sufficient to permit each spot on one separation to be matched with a spot on a different separation. This technique provides a method for estimation (at the described sensitivities) of the number of proteins made by any biological system. This system can resolve proteins differing in a single charge and consequently can be used in the analysis of in vivo modifications resulting in a change in charge. Proteins whose charge is changed by missense mutations can be identified. A detailed description of the methods as well as the characteristics of this system are presented.


Figures

Fig. 1
Fig. 1
Illustration of the slab gel plates. These plates are prepared as described in the text. All measurements are given in mm.
Fig. 2
Fig. 2
Separation of Escherichia coli proteins. E. coli (1100) was labeled with 14C-amino-acids as described under “Materials and Methods.” The cells were lysed by sonication, treated with DNase and RNase and dissolved in lysis buffer. Twenty-five microliters of sample containing 180,000 cpm and approximately 10 μg of protein were loaded on the gel. The isoelectric focusing gel was equilibrated for 30 min. The gel in the SDS dimension was a 9.25 to 14.4% exponential acrylamide gradient. A volume of 10 ml of 14.4% acrylamide was used in the front chamber of the gradient mixer. The total volume of the gel was 16 ml. At this exposure, 825 hours, it is possible to count 1000 spots on the original autoradiogram. All autoradiograms of two-dimensional gels were photographed with a metric ruler along two edges of the autoradiogram. These rulers establish a coordinate system which is used to give spot positions. The verticle scale is given in units from top to bottom. The horizontal scale is given in units from left to right. The coordinates are given as horizontal × vertical.
Fig. 3
Fig. 3
Comparison of spot dimensions to band widths. The one-dimensional SDS gel was run at the same time as the second dimension of the two-dimensional gel. Both SDS gels are exponential gradient gels (10 to 14% with 8 ml in the front chamber). The isoelectric focusing gel shown above the two-dimensional gel was run at the same time as the isoelectric focusing gel which was loaded on the second dimension. The one-dimensional isoelectric focusing gel shown was fixed in 50% trichloroacetic acid, rinsed in 7% acetic acid (overnight), and the whole gel was dried without any slicing. Lower exposures of the one-dimensional gels were scanned to obtain tracings from which the standard deviation was measured.
Fig. 4
Fig. 4
The effect of the amount of protein on spot size. The data were obtained from an analysis of six gels containing known amounts of Escherichia coli protein. Four of the gels used are shown in Fig. 5. The area of each spot and the amount of protein in each spot were determined as described under “Materials and Methods.” A different symbol is used to record the data collected for different spots. The coordinates given refer to Fig. 5A; ○ = 8.8 × 3.4, ● = 9.5 × 3.1, ▲ = 7.0 × 3.3. The size of these spots was measured from autoradiograms of much lower exposure than those shown in Fig. 5. Low exposure autoradiograms were used to avoid possible increases in spot size due to overexposure of the film.
Fig. 5
Fig. 5
Effect of increasing the amount of protein on the resolution is illustrated by the four two-dimensional separations shown. In all cases 350,000 cpm in 4μ g of 14C-labeled Escherichia coli protein were loaded on the gel. In addition, 3, 16, 32, and 128 μg of unlabeled E. coli protein were loaded on Gels A, B, C, and D, respectively. These preparations of E. coli protein were not treated with RNase and DNase. The slab gel is a uniform gel of 12.5% acrylamide. The autoradiograms illustrated were exposed for 72 hours.
Fig. 6
Fig. 6
Effect of amount of protein on spot shapes. The asymmetric expansion of a spot is illustrated. The spots toward the right represent larger amounts of protein. The horizontal line indicates the position which should be used for determination of molecular weight. The spots are symmetric in the isoelectric focusing dimension.
Fig. 7
Fig. 7
Positional reproducibility is illustrated in this figure as well as Fig. 5, A and B. The samples subjected to electrophoresis in these gels were prepared from Escherichia coli 5333 (19) (cyclic adenosine 3′:5′-monophosphate binding protein mutant) grown in the presence of adenosine 5′-monophosphate (A) or cyclic guanosine 3′:5′-monophosphate (B). These samples contained 300,000 cpm and approximately 15 μg of protein. The isoelectric focusing gels were run at the same time, equilibrated for 30 min, and run on 9 to 15% exponential, acrylamide gradient, slab gels (6 ml in the front chamber). The gels were exposed for 30 hours. The slight difference in growth conditions for the bacteria used to prepare the two samples has resulted in several quantitative differences which are evident on close inspection.
Fig. 8
Fig. 8
A histogram representing the number of proteins versus per cent abundance. A sample prepared from Escherichia coli 1100 and containing 300,000 cpm and 25 μg of protein was subjected to electrophoresis. The isoelectric focusing gel was equilibrated for 2 hours and run on a 12.8% acrylamide gel. Films were exposed to this gel (and a standardization wedge) for various times from 30 min to 50 days. All of the spots selected on these autoradiograms were quantified and the number of spots within an interval was plotted. The quantity interval used was a factor of 2 and these invervals are plotted on a logarithmic scale. The per cent abundance is the amount of an individual protein expressed as a per cent of the total amount of protein. The shaded area represents the number of spots summed in order to determine the number of proteins whose per cent abundance is between 0.05 and 0.01% of the total (used for the calculation presented under “Results and Discussion”).
Fig. 9
Fig. 9
The pH gradient measured with and without urea. The pH gradient was measured as described under “Materials and Methods.” In one case the gel selections were placed in degassed water (●) for measurement, whereas in the other case the sections were placed in 9.2 m urea (▲). The top of the gel is on the right.
Fig. 10
Fig. 10
The detection of a missense mutation in T4 gene 32. Samples prepared from T4 infected Escherichia coli (AS19) were subjected to electrophoresis and autoradiograms prepared. Sections of these autoradiograms are shown. The patterns shown were produced by infections with wild type T4 (A) an amber mutant in gene 32 (B), a ts mutant (tsP7) in gene 32 (C), and another ts mutant (tsL170) in gene 32 (D). The spot corresponding to the gene 32 protein was identified by comparing Patterns A and B. A major spot (A, coordinates 2.05 × 1.15) is missing in Pattern B. This spot corresponds to the gene 32 protein. In the pattern shown in Panel C the spot corresponding to the gene 32 protein can still be seen; however, its position (coordinates 2.45 × 1.2) has shifted in comparison to the wild type gene 32. The gene 32 proteins seen in Panel D appears to be in the same position as wild type gene 32 protein. The pattern obtained from the gene 32 amber mutant is missing one minor spot in addition to the gene 32 protein. This minor spot is seen in Panels A, C, and D (coordinates 0.5 × 0.6). It is concluded that this amber mutant (HL618) contains two amber mutations, one in gene 32 and the other in a nonessential gene.
Fig. 11
Fig. 11
Artifactual multiple spots due to induced charge heterogeneity. Escherichia coli (AS19) was labeled with 35SO4 as described under “Materials and Methods” and the labeled cells were stored frozen for 1 month. The cells were lysed in lysis buffer without RNase or DNase treatment. The SDS slab gel was a uniform concentration (13%) of acrylamide. Since there were almost no spots on the lower part of this gel, the lower one-third of the gel is not shown.
Fig. 12
Fig. 12
Artifactual multiple spots in the SDS dimension. Escherichia coli 5333 was grown in the presence of guanosine 5′-monophosphate and labeled with 14C-amino-acids. The cells were lysed by sonication, the lysate was treated with RNase and DNase, and urea and lysis buffer were added. This sample was subjected to electrophoresis under conditions similar to those described in Fig. 7. The film was exposed for 26 days and a section of the resulting autoradiogram is shown. Although this is a longer exposure it can be compared to the autoradiograms shown in Fig. 7. The section shown here corresponds to an area included between two vertical lines at 5.8 and 11.8 and two horizontal lines at 0.8 and 5.8 on the autoradiogram shown in Fig. 7A. The artifactual spots appear as a series of spots at the same position in the isoelectric focusing dimension and with different positions in the SDS dimension. These spots appear below many of the more abundant proteins, particularly below major high molecular weight proteins. A series of artifactual multiple spots can be seen along the vertical line at position 1.1.
Fig. 13
Fig. 13
Separation of proteins from Caenorhabdilis elegans. C. elegans was labeled as described under “Materials and Methods,” and lysed by sonication. The lysate was treated with RNase and DNase, and urea and lysis buffer were added. The sample applied to the gel contained 400,000 cpm and 3 μg of protein. The autoradiogram shown was exposed to the gel for 515 hours.

Similar articles

Cited by

References

    1. Laemmli UK. Nature. 1970;227:680–685. - PubMed
    1. O'Farrell PZ, Gold LM, Huang WM. J Biol Chem. 1973;248:5499–5501. - PubMed
    1. O'Farrell PZ, Gold LM. J Biol Chem. 1973;248:5502–5511. - PubMed
    1. O'Farrell PZ, Gold LM. J Biol Chem. 1973;248:5512–5519. - PubMed
    1. Studier FW. Science. 1972;176:367–376. - PubMed

Publication types

MeSH terms

LinkOut - more resources