

Heme catabolism by heme oxygenase-1 confers host resistance to Mycobacterium infection
- PMID: 23630967
- PMCID: PMC3697604
- DOI: 10.1128/IAI.00251-13
Heme catabolism by heme oxygenase-1 confers host resistance to Mycobacterium infection
Abstract
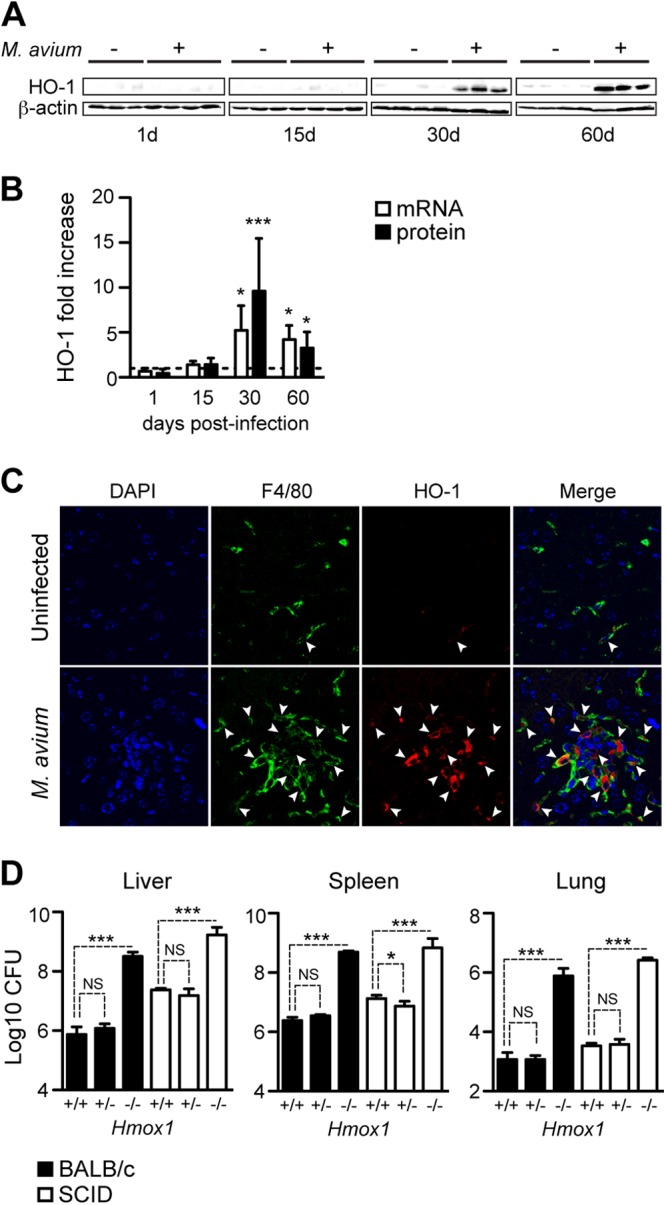
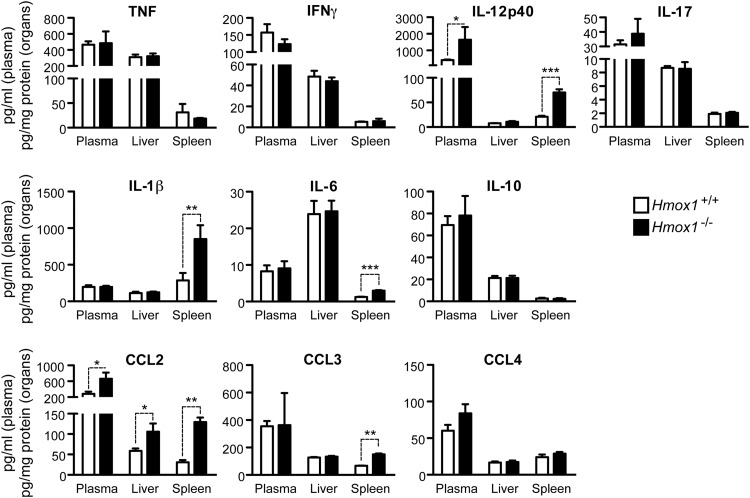
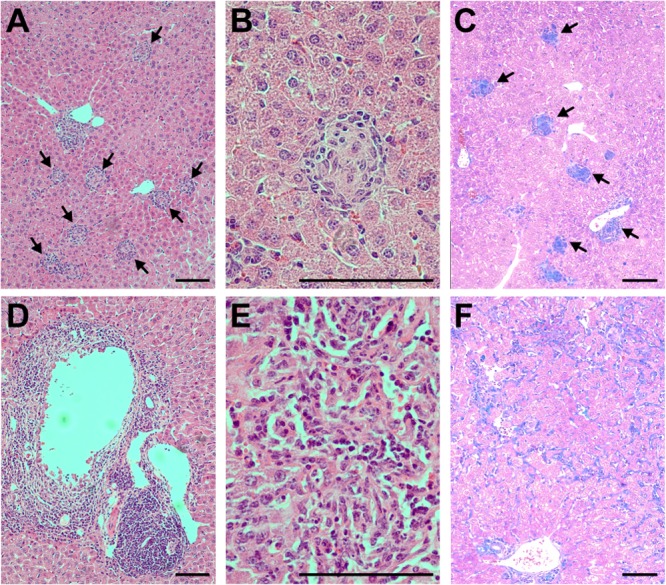
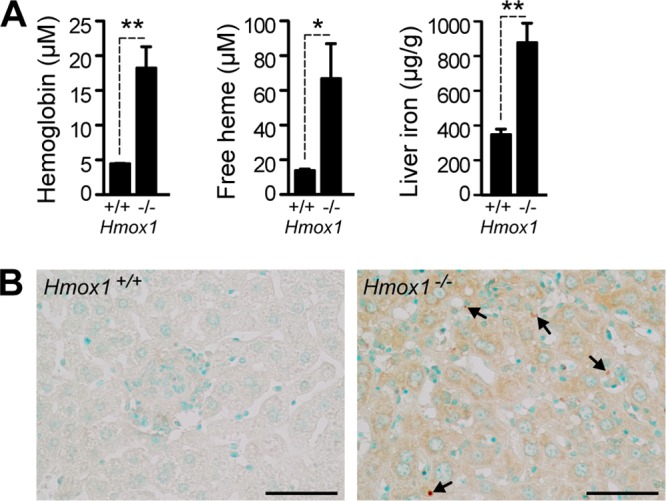
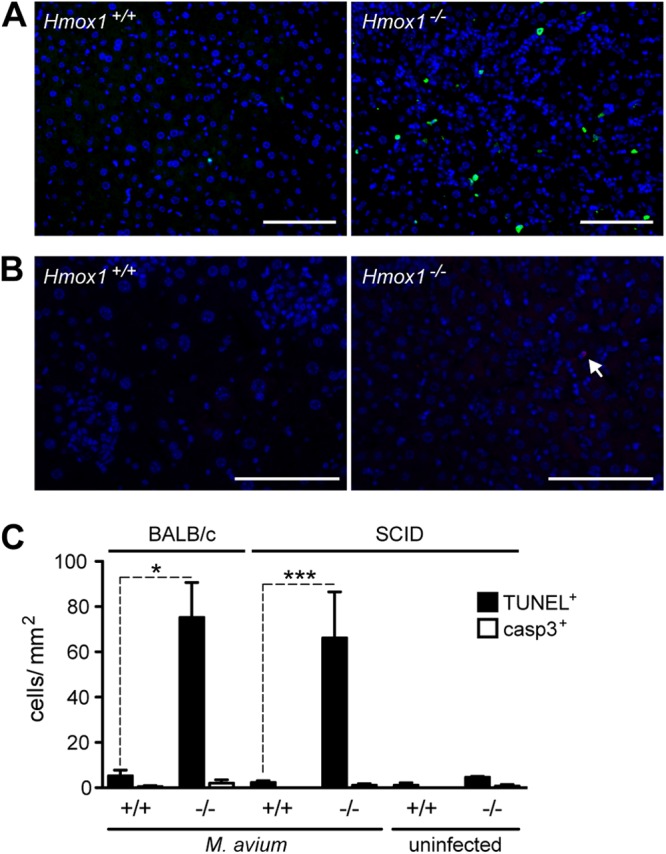
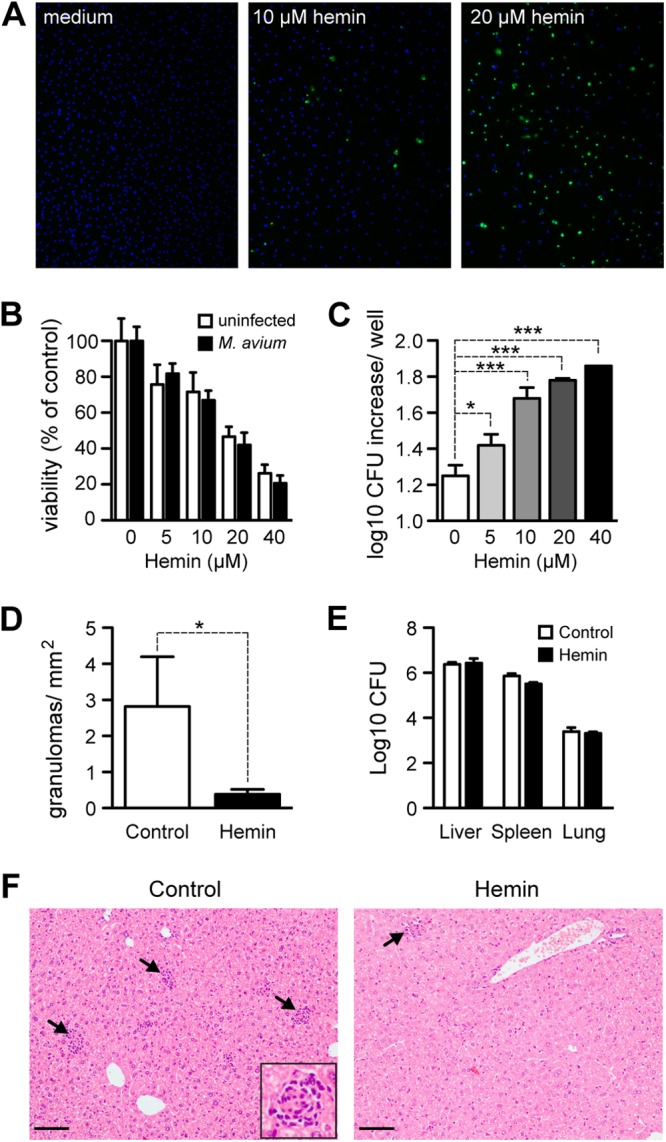
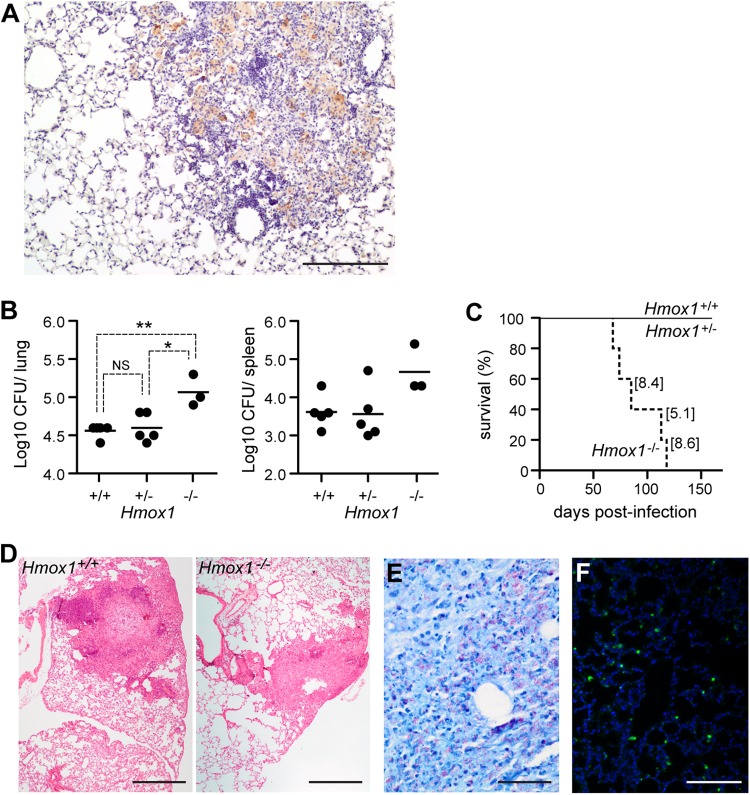
Heme oxygenases (HO) catalyze the rate-limiting step of heme degradation. The cytoprotective action of the inducible HO-1 isoform, encoded by the Hmox1 gene, is required for host protection against systemic infections. Here we report that upregulation of HO-1 expression in macrophages (M) is strictly required for protection against mycobacterial infection in mice. HO-1-deficient (Hmox1(-/-)) mice are more susceptible to intravenous Mycobacterium avium infection, failing to mount a protective granulomatous response and developing higher pathogen loads, than infected wild-type (Hmox1(+/+)) controls. Furthermore, Hmox1(-/-) mice also develop higher pathogen loads and ultimately succumb when challenged with a low-dose aerosol infection with Mycobacterium tuberculosis. The protective effect of HO-1 acts independently of adaptive immunity, as revealed in M. avium-infected Hmox1(-/-) versus Hmox1(+/+) SCID mice lacking mature B and T cells. In the absence of HO-1, heme accumulation acts as a cytotoxic pro-oxidant in infected M, an effect mimicked by exogenous heme administration to M. avium-infected wild-type M in vitro or to mice in vivo. In conclusion, HO-1 prevents the cytotoxic effect of heme in M, contributing critically to host resistance to Mycobacterium infection.
Figures
Similar articles
-
Heme oxygenase-1 promotes granuloma development and protects against dissemination of mycobacteria.Lab Invest. 2012 Nov;92(11):1541-52. doi: 10.1038/labinvest.2012.125. Epub 2012 Sep 10. Lab Invest. 2012. PMID: 22964851 Free PMC article.
-
Pharmacological Inhibition of Host Heme Oxygenase-1 Suppresses Mycobacterium tuberculosis Infection In Vivo by a Mechanism Dependent on T Lymphocytes.mBio. 2016 Oct 25;7(5):e01675-16. doi: 10.1128/mBio.01675-16. mBio. 2016. PMID: 27795400 Free PMC article.
-
Attenuated heme oxygenase-1 responses predispose the elderly to pulmonary nontuberculous mycobacterial infections.Am J Physiol Lung Cell Mol Physiol. 2016 Nov 1;311(5):L928-L940. doi: 10.1152/ajplung.00397.2015. Epub 2016 Sep 30. Am J Physiol Lung Cell Mol Physiol. 2016. PMID: 27694475 Free PMC article.
-
Natural and trained innate immunity against Mycobacterium tuberculosis.Immunobiology. 2020 May;225(3):151951. doi: 10.1016/j.imbio.2020.151951. Epub 2020 Apr 27. Immunobiology. 2020. PMID: 32423788 Review.
-
A Dual Role of Heme Oxygenase-1 in Tuberculosis.Front Immunol. 2022 Feb 25;13:842858. doi: 10.3389/fimmu.2022.842858. eCollection 2022. Front Immunol. 2022. PMID: 35281042 Free PMC article. Review.
Cited by
-
The emerging role of gasotransmitters in the pathogenesis of tuberculosis.Nitric Oxide. 2016 Sep 30;59:28-41. doi: 10.1016/j.niox.2016.06.009. Epub 2016 Jul 4. Nitric Oxide. 2016. PMID: 27387335 Free PMC article. Review.
-
Antimycobacterial effect of IFNG (interferon gamma)-induced autophagy depends on HMOX1 (heme oxygenase 1)-mediated increase in intracellular calcium levels and modulation of PPP3/calcineurin-TFEB (transcription factor EB) axis.Autophagy. 2018;14(6):972-991. doi: 10.1080/15548627.2018.1436936. Epub 2018 May 10. Autophagy. 2018. PMID: 29457983 Free PMC article.
-
Anemia, Iron Status, and HIV: A Systematic Review of the Evidence.Adv Nutr. 2020 Sep 1;11(5):1334-1363. doi: 10.1093/advances/nmaa037. Adv Nutr. 2020. PMID: 32383731 Free PMC article.
-
The Iron age of host-microbe interactions.EMBO Rep. 2015 Nov;16(11):1482-500. doi: 10.15252/embr.201540558. Epub 2015 Oct 16. EMBO Rep. 2015. PMID: 26474900 Free PMC article. Review.
-
Heme oxygenase 1 controls early innate immune response of macrophages to Salmonella Typhimurium infection.Cell Microbiol. 2016 Oct;18(10):1374-89. doi: 10.1111/cmi.12578. Epub 2016 Mar 18. Cell Microbiol. 2016. PMID: 26866925 Free PMC article.
References
-
- Walzl G, Ronacher K, Hanekom W, Scriba TJ, Zumla A. 2011. Immunological biomarkers of tuberculosis. Nat. Rev. Immunol. 11:343–354 - PubMed
-
- Johnson MM, Waller EA, Leventhal JP. 2008. Nontuberculous mycobacterial pulmonary disease. Curr. Opin. Pulm. Med. 14:203–210 - PubMed
-
- Appelberg R. 2006. Pathogenesis of Mycobacterium avium infection: typical responses to an atypical mycobacterium? Immunol. Res. 35:179–190 - PubMed
Publication types
MeSH terms
Substances
Grants and funding
LinkOut - more resources
Full Text Sources
Other Literature Sources
Medical
Molecular Biology Databases
