. 2013 Apr 30;8(1):198.
doi: 10.1186/1556-276X-8-198.

Cytotoxicity of quantum dots and graphene oxide to erythroid cells and macrophages

Affiliations

Cytotoxicity of quantum dots and graphene oxide to erythroid cells and macrophages

Guangbo Qu et al. Nanoscale Res Lett. .

Abstract

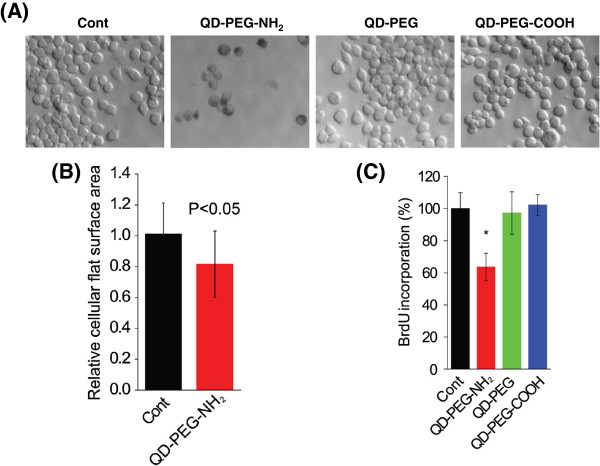
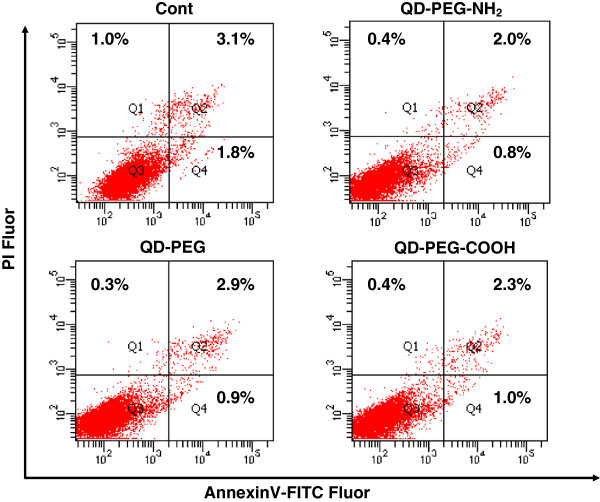
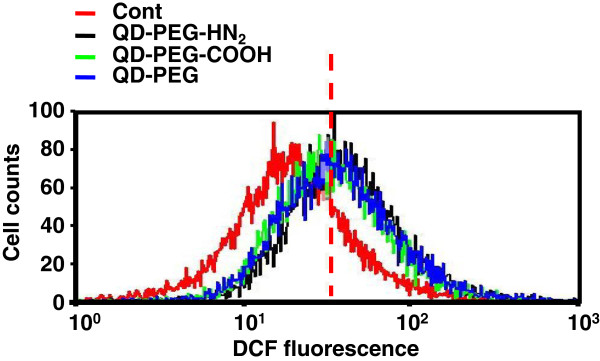
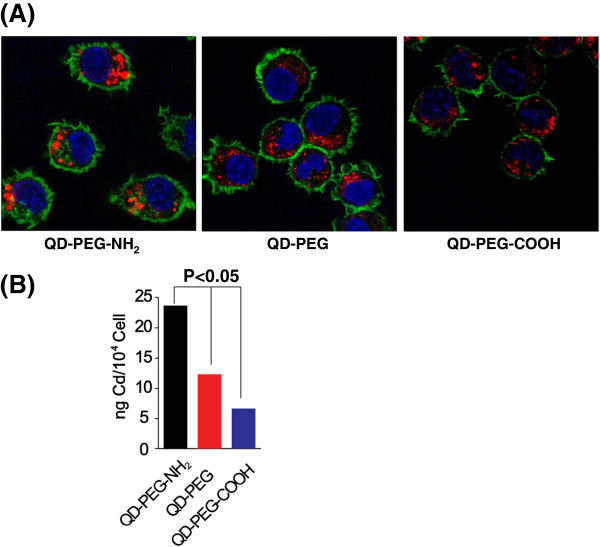
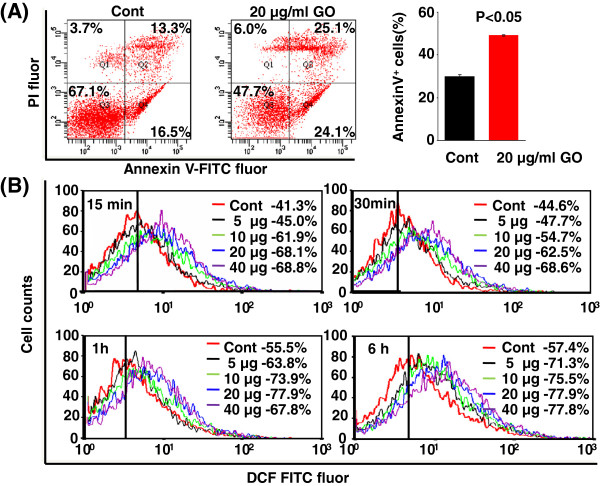
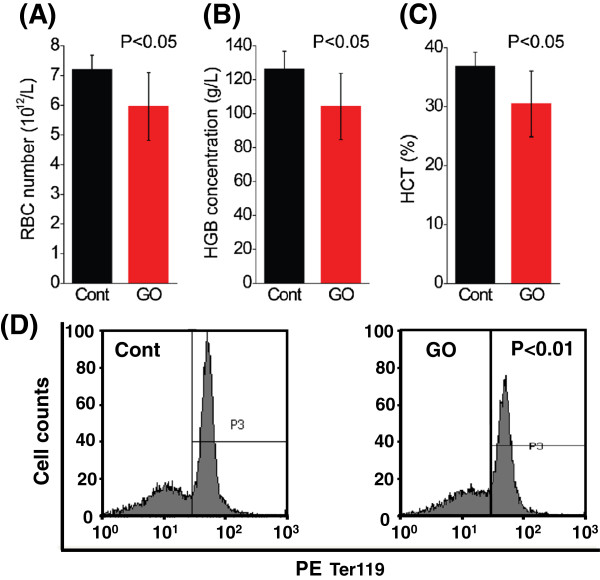
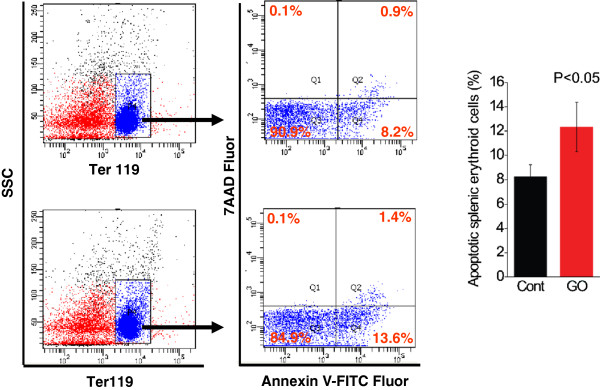
Great concerns have been raised about the exposure and possible adverse influence of nanomaterials due to their wide applications in a variety of fields, such as biomedicine and daily lives. The blood circulation system and blood cells form an important barrier against invaders, including nanomaterials. However, studies of the biological effects of nanomaterials on blood cells have been limited and without clear conclusions thus far. In the current study, the biological influence of quantum dots (QDs) with various surface coating on erythroid cells and graphene oxide (GO) on macrophages was closely investigated. We found that QDs posed great damage to macrophages through intracellular accumulation of QDs coupled with reactive oxygen species generation, particularly for QDs coated with PEG-NH2. QD modified with polyethylene glycol-conjugated amine particles exerted robust inhibition on cell proliferation of J744A.1 macrophages, irrespective of apoptosis. Additionally, to the best of our knowledge, our study is the first to have demonstrated that GO could provoke apoptosis of erythroid cells through oxidative stress in E14.5 fetal liver erythroid cells and in vivo administration of GO-diminished erythroid population in spleen, associated with disordered erythropoiesis in mice.


Figures

Figure 1
Figure 1
Biological influence of QDs on J774A.1 cells. (A) Bright field images of J774A.1 cells treated with QDs with different surface modifications at 47 μg/ml for 5 days (×40). (B) The bar graph represents the relative cellular flat surface area of J774A.1 cells treated with 47 μg/ml QDs coated with PEG-NH2 for 5 days (n = 50). (C) Cell proliferation was evaluated with the BrdU incorporation assay upon treatment with 47 μg/ml QDs with different surface modifications for 24 h (n = 6). Asterisk indicates P < 0.001.
Figure 2
Figure 2
Cell death of J774A.1 cells in response to QD treatment. Representative images of cell death of J774A.1 cells after 24-h treatment with 47 μg/ml QDs with different surface modifications assessed by FACS analysis with FITC Annexin V and PI staining.
Figure 3
Figure 3
ROS generation upon QD treatment in J774A.1 cells. FACS analysis of the relative intensity of DCF fluorescence reflecting intracellular ROS level after exposure to QDs with different surface modifications at 47 μg/ml in fetal liver cells for 6 h.
Figure 4
Figure 4
Localization of QDs in J774A.1 cells. (A) Cells after treatment with 47 μg/ml QDs for 24 h were co-stained with DAPI and FITC-conjugated phalloidin. Fluorescence for DAPI (blue), FITC (green), and QDs (red) was examined through confocal laser scanning microscopy. The three colors were merged together. Original magnification, ×400. (B) Intracellular cadmium mass in cells after exposure to QDs with different surface modifications for 24 h was analyzed by ICP-MS (n = 3).
Figure 5
Figure 5
GO-triggered cell death of erythroid cells through apoptosis. (A) Representative FACS images describing fetal liver cell death upon GO treatment at 20 μg/ml for 24 h using Annexin V and PI staining. (B) FACS analysis of relative fluorescent intensity reflecting ROS content after GO exposure at various concentrations at different time points in fetal liver cells. ANOVA was used to determine the mean difference in cells treated with GO at different concentrations and along time course compared to control.
Figure 6
Figure 6
Results of CBC indexes. After a 3-week treatment, mice were sacrificed, and peripheral blood was collected via the heart followed by CBC analysis. (A) Red blood cell (RBC) counts, (B) hemoglobin concentration (HGB), and (C) hematocrit (HCT). (D) After mincing of spleens, the single-cell suspensions were stained with PE conjugated with Ter119+ to label erythroid progenitor population and were then subject to FACS analysis.
Figure 7
Figure 7
GO-promoted cell death of splenic erythroid cells. FACS analysis of proportion of apoptotic erythroid cells (Ter119+ cell population). The single-cell suspensions from spleens were simultaneously stained with PE-conjugated anti-Ter119 Ab, FITC-conjugated Annexin V, and 7AAD to sort the apoptotic Ter119+ in spleens. After sorting in the first left gate, Ter119 positive cells were selected and then further analyzed for cell death. The quantified data for the average percentage of apoptotic Ter119+ cells are shown in the bar graph (n = 4).

References

    1. Pelley JL, Daar AS, Saner MA. State of academic knowledge on toxicity and biological fate of quantum dots. Toxicol Sci. 2009;8(2):276–296. doi: 10.1093/toxsci/kfp188. - DOI - PMC - PubMed
    1. Yong KT, Law WC, Hu R, Ye L, Liu L, Swihart MT, Prasad PN. Nanotoxicity assessment of quantum dots: from cellular to primate studies. Chem Soc Rev. 2012;8(3):1236–1250. - PubMed
    1. Chang YL, Yang ST, Liu JH, Dong E, Wang YW, Cao AN, Liu YF, Wang HF. In vitro toxicity evaluation of graphene oxide on A549 cells. Toxicol Lett. 2011;8(3):201–210. doi: 10.1016/j.toxlet.2010.11.016. - DOI - PubMed
    1. Zhang YB, Ali SF, Dervishi E, Xu Y, Li ZR, Casciano D, Biris AS. Cytotoxicity effects of graphene and single-wall carbon nanotubes in neural phaeochromocytoma-derived PC12 Cells. ACS Nano. 2010;8(6):3181–3186. doi: 10.1021/nn1007176. - DOI - PubMed
    1. Hardman R. A toxicologic review of quantum dots: toxicity depends on physicochemical and environmental factors. Environ Health Perspect. 2006;8(2):165–172. doi: 10.1289/ehp.8284. - DOI - PMC - PubMed

LinkOut - more resources