

Large terminase conformational change induced by connector binding in bacteriophage T7
- PMID: 23632014
- PMCID: PMC3675631
- DOI: 10.1074/jbc.M112.448951
Large terminase conformational change induced by connector binding in bacteriophage T7
Abstract
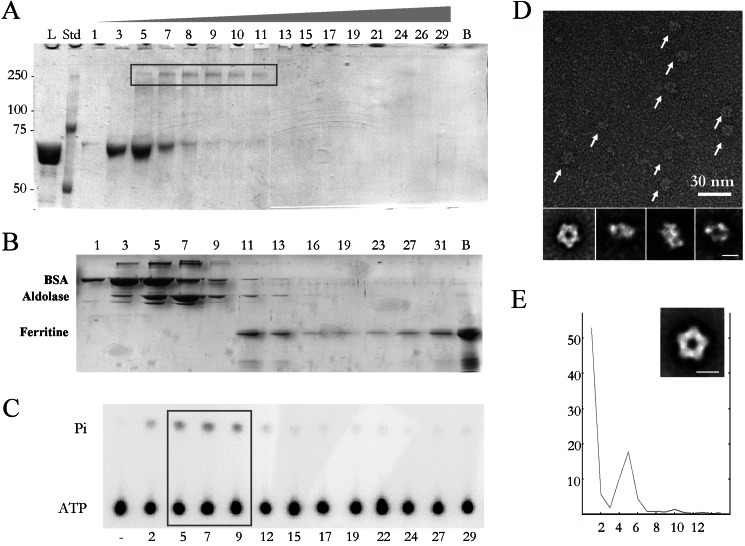
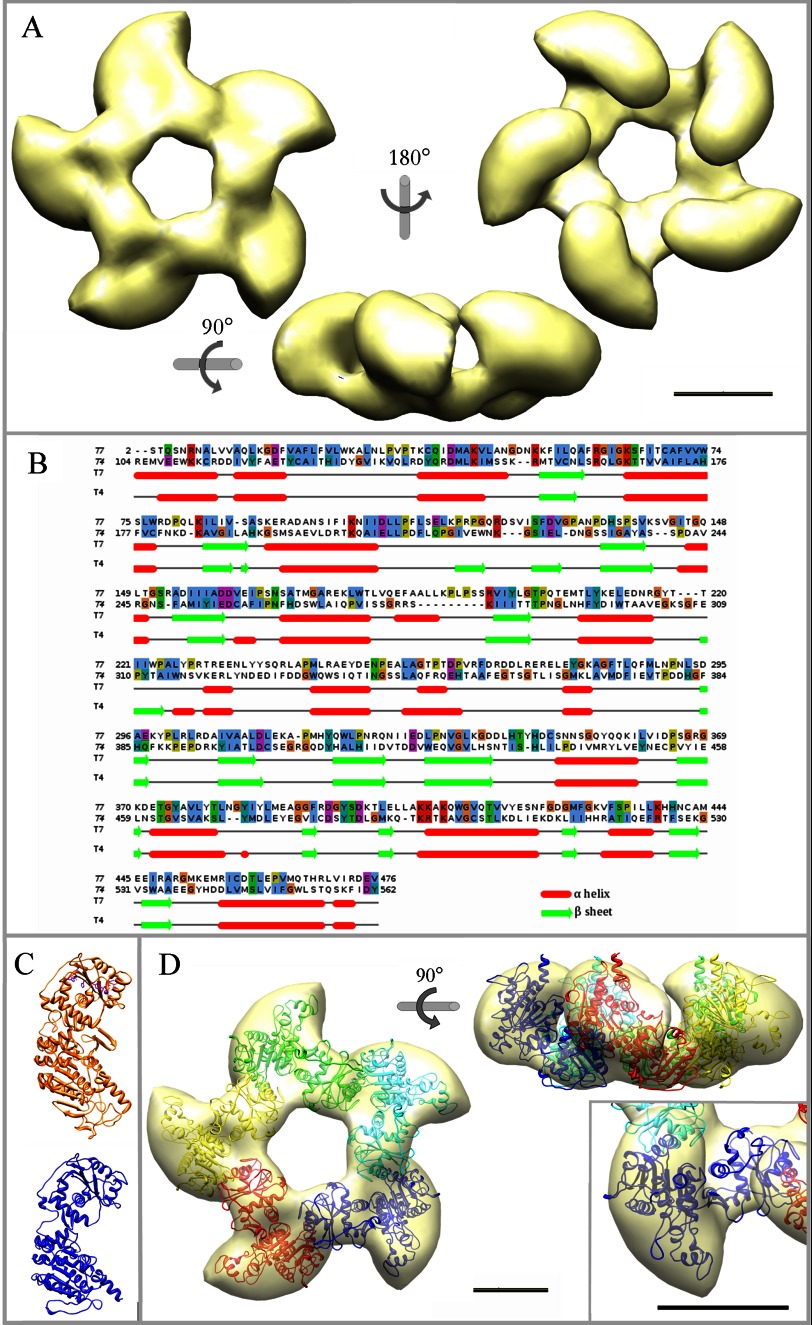
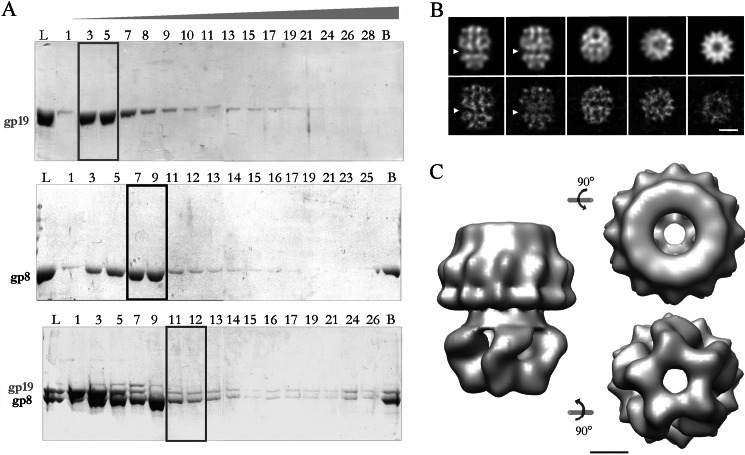
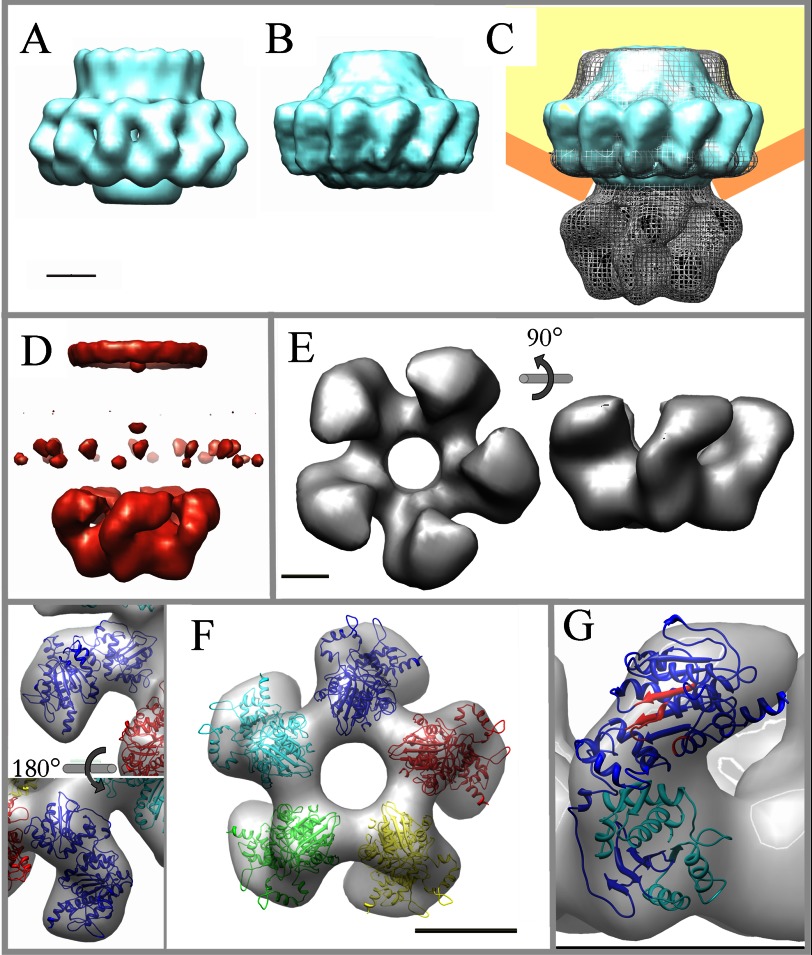
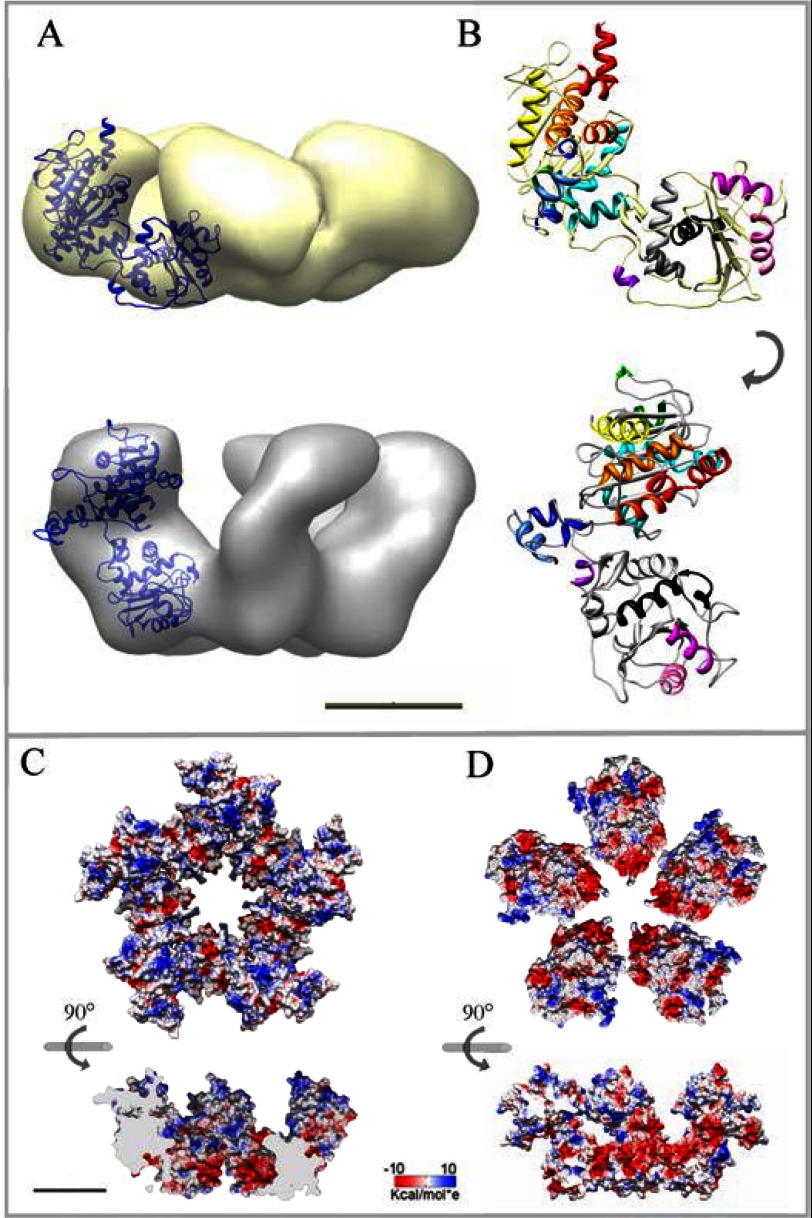
During bacteriophage morphogenesis DNA is translocated into a preformed prohead by the complex formed by the portal protein, or connector, plus the terminase, which are located at an especial prohead vertex. The terminase is a powerful motor that converts ATP hydrolysis into mechanical movement of the DNA. Here, we have determined the structure of the T7 large terminase by electron microscopy. The five terminase subunits assemble in a toroid that encloses a channel wide enough to accommodate dsDNA. The structure of the complete connector-terminase complex is also reported, revealing the coupling between the terminase and the connector forming a continuous channel. The structure of the terminase assembled into the complex showed a different conformation when compared with the isolated terminase pentamer. To understand in molecular terms the terminase morphological change, we generated the terminase atomic model based on the crystallographic structure of its phage T4 counterpart. The docking of the threaded model in both terminase conformations showed that the transition between the two states can be achieved by rigid body subunit rotation in the pentameric assembly. The existence of two terminase conformations and its possible relation to the sequential DNA translocation may shed light into the molecular bases of the packaging mechanism of bacteriophage T7.
Keywords: ATPases; Bacteriophage; DNA Packaging; DNA Translocation; Electron Microscopy (EM); Protein Conformation; Single Particle Reconstruction; Terminase; Virus Assembly.
Figures
Similar articles
-
The bacteriophage DNA packaging machine.Adv Exp Med Biol. 2012;726:489-509. doi: 10.1007/978-1-4614-0980-9_22. Adv Exp Med Biol. 2012. PMID: 22297528 Review.
-
Nucleotides regulate the conformational state of the small terminase subunit from bacteriophage lambda: implications for the assembly of a viral genome-packaging motor.Biochemistry. 2005 Jul 19;44(28):9645-56. doi: 10.1021/bi050333e. Biochemistry. 2005. PMID: 16008350
-
Structure, assembly, and DNA packaging of the bacteriophage T4 head.Adv Virus Res. 2012;82:119-53. doi: 10.1016/B978-0-12-394621-8.00018-2. Adv Virus Res. 2012. PMID: 22420853 Free PMC article. Review.
-
Stepwise motion of a microcantilever driven by the hydrolysis of viral ATPases.Nanotechnology. 2012 Jan 13;23(1):015501. doi: 10.1088/0957-4484/23/1/015501. Epub 2011 Dec 8. Nanotechnology. 2012. PMID: 22156040
-
Dynamics of the T4 bacteriophage DNA packasome motor: endonuclease VII resolvase release of arrested Y-DNA substrates.J Biol Chem. 2011 May 27;286(21):18878-89. doi: 10.1074/jbc.M111.222828. Epub 2011 Mar 29. J Biol Chem. 2011. PMID: 21454482 Free PMC article.
Cited by
-
Structural characterization of the bacteriophage T7 tail machinery.J Biol Chem. 2013 Sep 6;288(36):26290-26299. doi: 10.1074/jbc.M113.491209. Epub 2013 Jul 24. J Biol Chem. 2013. PMID: 23884409 Free PMC article.
-
Characterization and genome analysis of a novel bacteriophage vB_SpuP_Spp16 that infects Salmonella enterica serovar pullorum.Virus Genes. 2019 Aug;55(4):532-540. doi: 10.1007/s11262-019-01664-0. Epub 2019 Apr 19. Virus Genes. 2019. PMID: 31004278
-
Biophysical analysis of Pseudomonas-phage PaP3 small terminase suggests a mechanism for sequence-specific DNA-binding by lateral interdigitation.Nucleic Acids Res. 2020 Nov 18;48(20):11721-11736. doi: 10.1093/nar/gkaa866. Nucleic Acids Res. 2020. PMID: 33125059 Free PMC article.
-
Insights into a viral motor: the structure of the HK97 packaging termination assembly.Nucleic Acids Res. 2023 Jul 21;51(13):7025-7035. doi: 10.1093/nar/gkad480. Nucleic Acids Res. 2023. PMID: 37293963 Free PMC article.
-
Nucleotide-type chemical shift assignment of the encapsulated 40 kbp dsDNA in intact bacteriophage T7 by MAS solid-state NMR.J Biomol NMR. 2014 Aug;59(4):219-30. doi: 10.1007/s10858-014-9840-4. Epub 2014 May 30. J Biomol NMR. 2014. PMID: 24875850
References
-
- Bamford D. H., Grimes J. M., Stuart D. I. (2005) What does structure tell us about virus evolution? Curr. Opin. Struct. Biol. 15, 655–663 - PubMed
-
- Cuervo A., Carrascosa J. L. (2012) Bacteriophages. Structure. eLS, DOI 10.1002/9780470015902.a0024053 - DOI
-
- Mettenleiter T. C., Klupp B. G., Granzow H. (2006) Herpesvirus assembly. A tale of two membranes. Curr. Opin. Microbiol. 9, 423–429 - PubMed
-
- Fuller D. N., Raymer D. M., Rickgauer J. P., Robertson R. M., Catalano C. E., Anderson D. L., Grimes S., Smith D. E. (2007) Measurements of single DNA molecule packaging dynamics in bacteriophage λ reveal high forces, high motor processivity, and capsid transformations. J. Mol. Biol. 373, 1113–1122 - PMC - PubMed
Publication types
MeSH terms
Substances
Associated data
- Actions
- Actions
LinkOut - more resources
Full Text Sources
Other Literature Sources
