. 2013 Jun 28;288(26):18923-38.
doi: 10.1074/jbc.M113.467316. Epub 2013 Apr 30.

Folding of a cyclin box: linking multitarget binding to marginal stability, oligomerization, and aggregation of the retinoblastoma tumor suppressor AB pocket domain

Affiliations

Folding of a cyclin box: linking multitarget binding to marginal stability, oligomerization, and aggregation of the retinoblastoma tumor suppressor AB pocket domain

Lucía B Chemes et al. J Biol Chem. .

Abstract

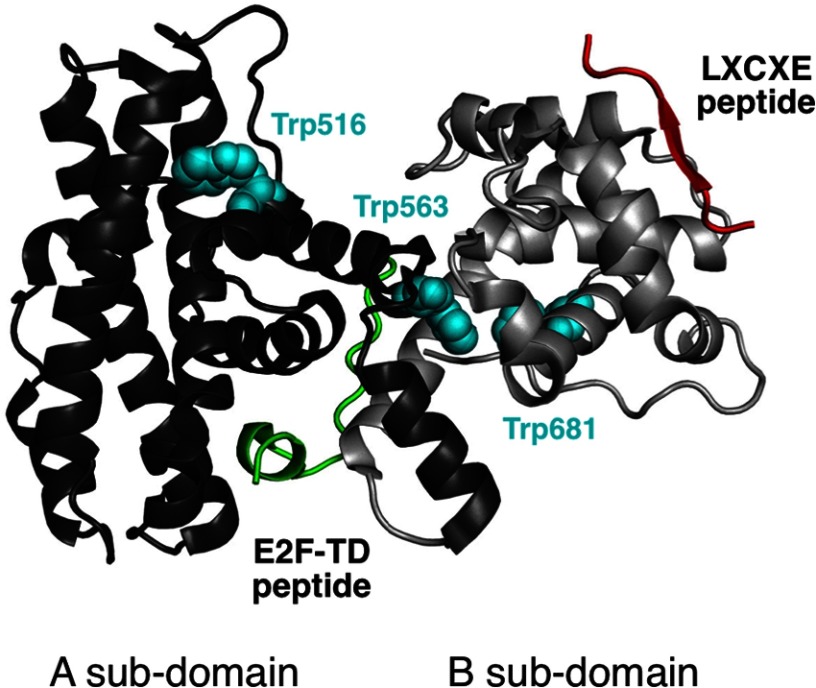
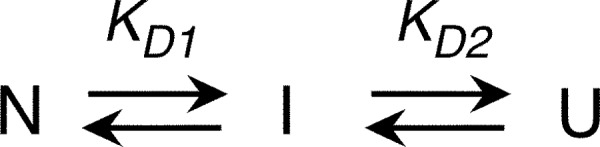
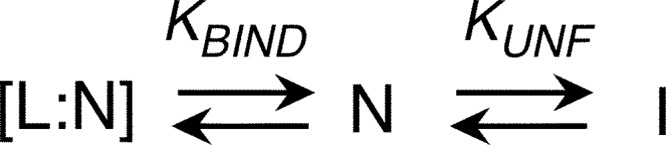
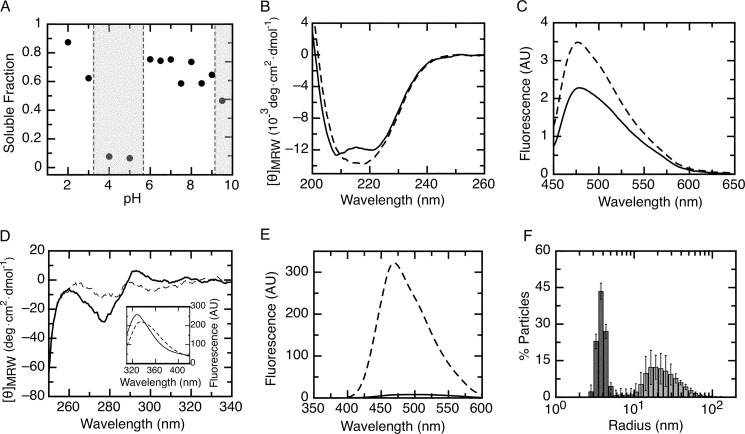
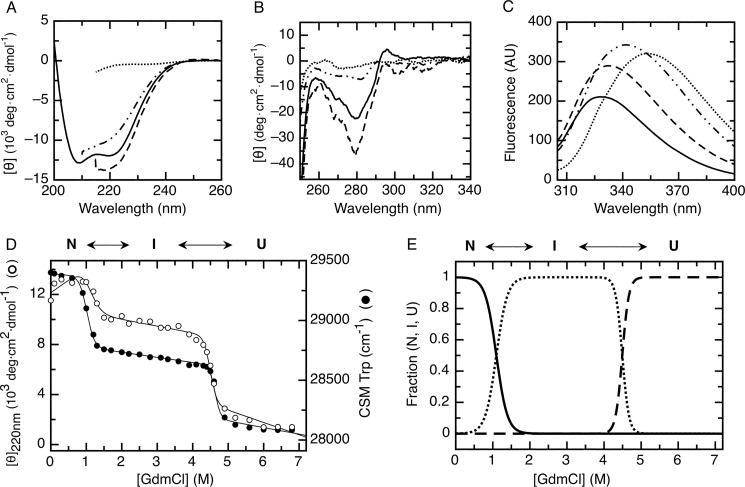
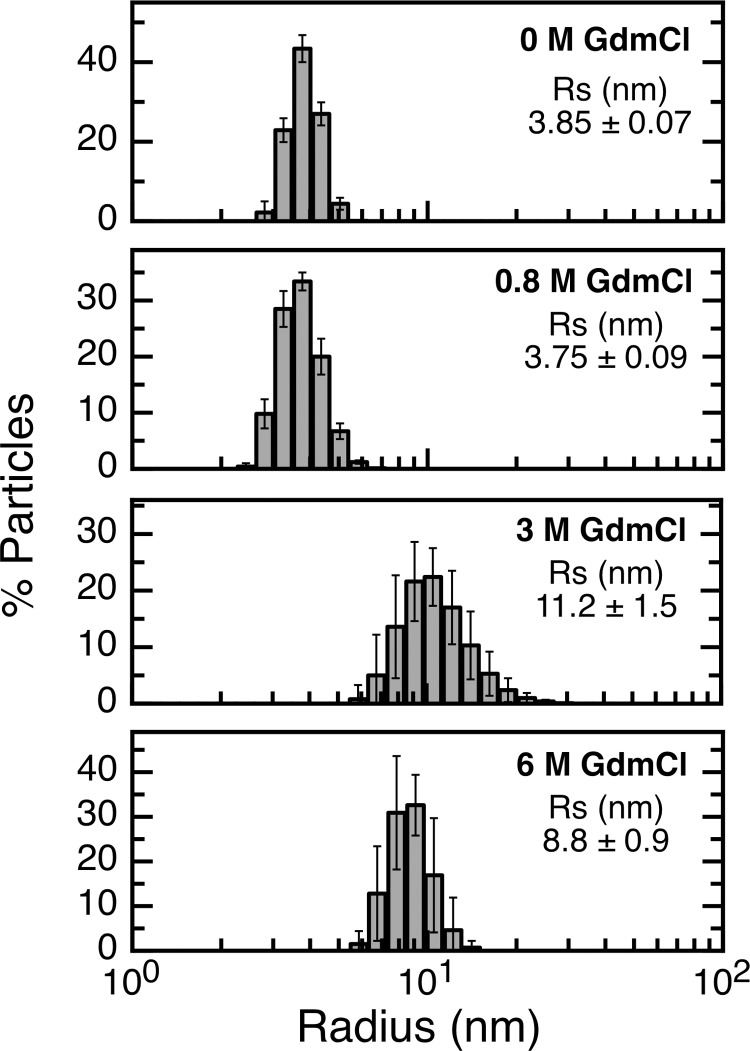
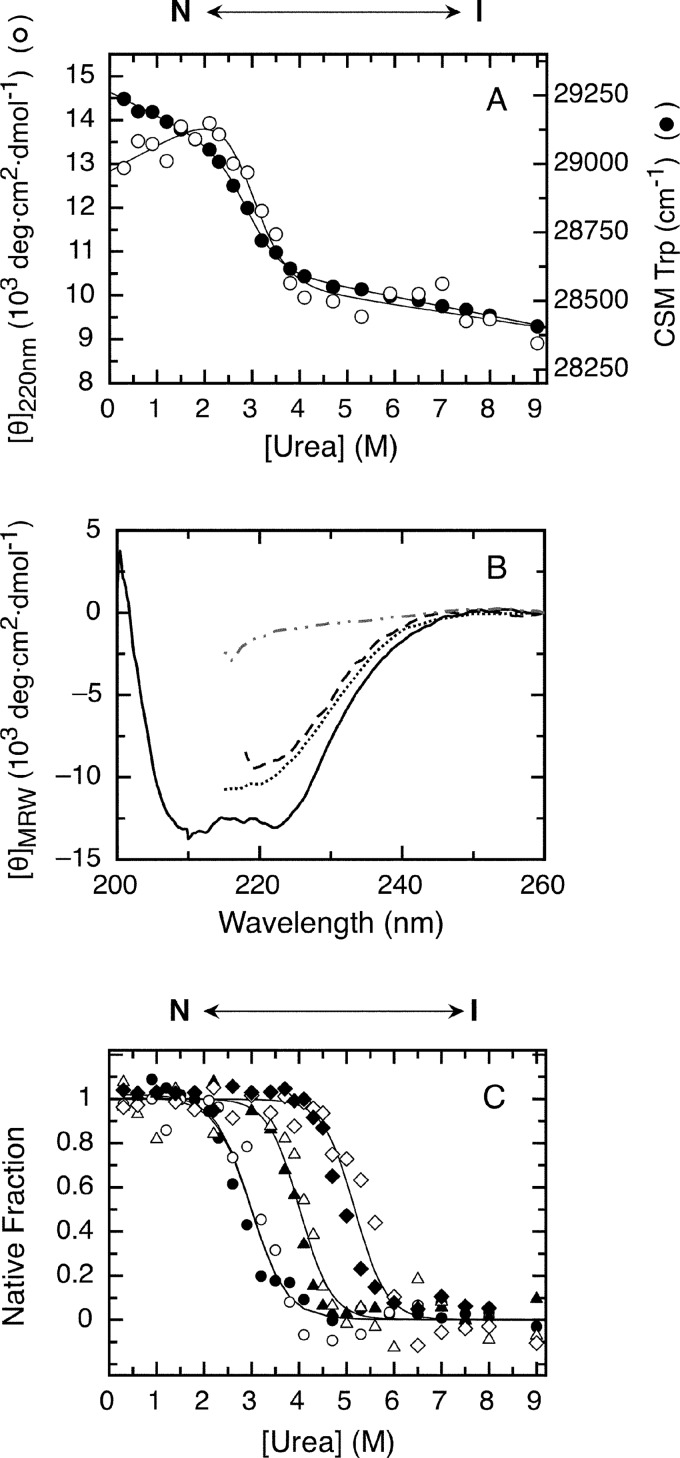
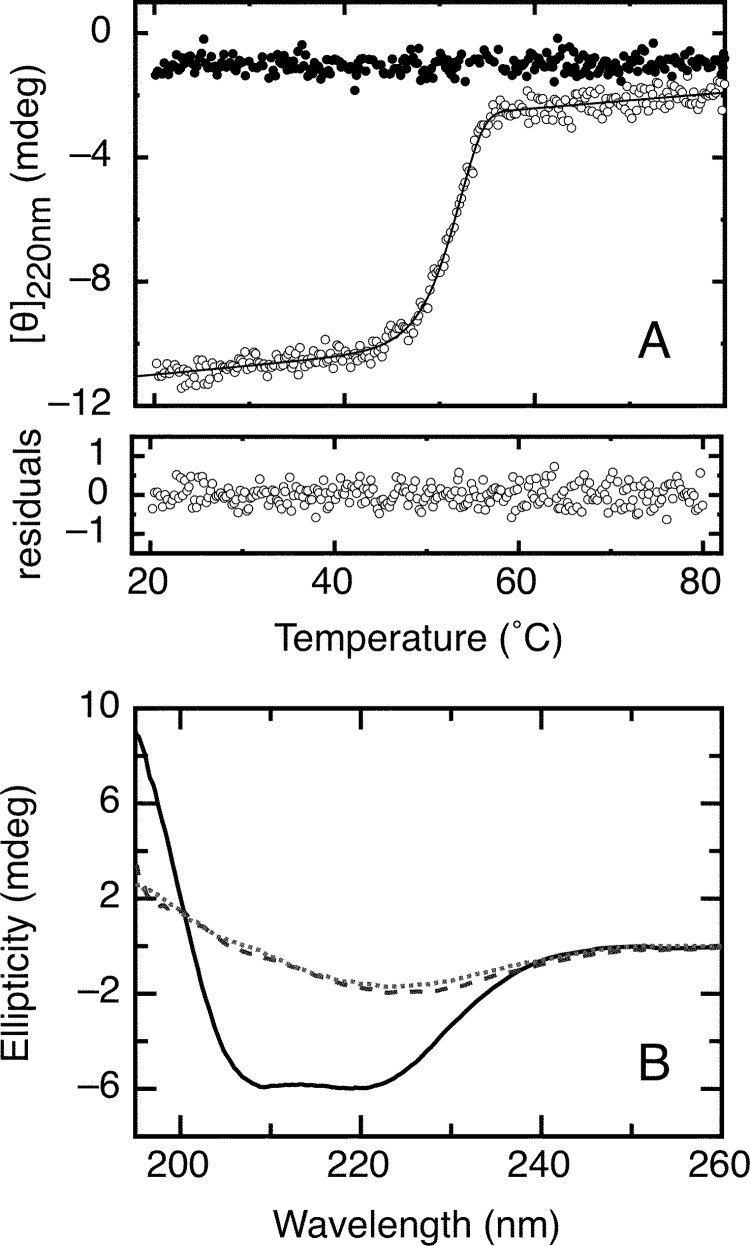
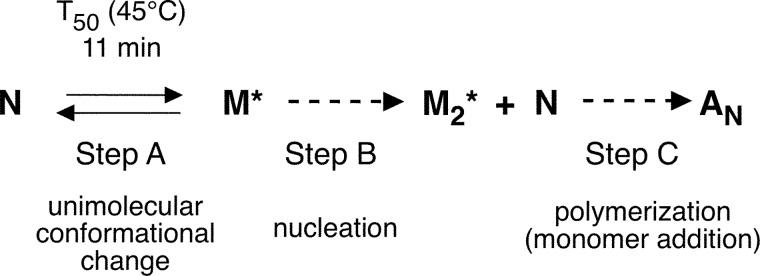
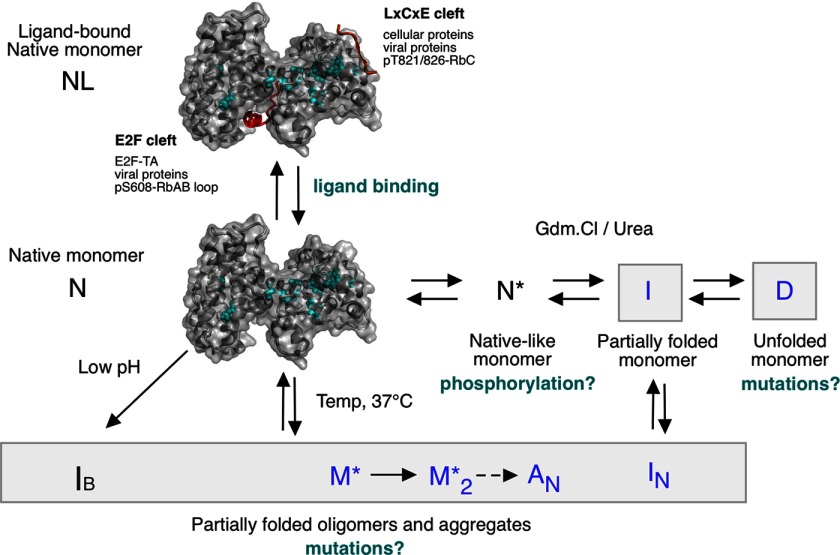
The retinoblastoma tumor suppressor (Rb) controls the proliferation, differentiation, and survival of cells in most eukaryotes with a role in the fate of stem cells. Its inactivation by mutation or oncogenic viruses is required for cellular transformation and eventually carcinogenesis. The high conservation of the Rb cyclin fold prompted us to investigate the link between conformational stability and ligand binding properties of the RbAB pocket domain. RbAB unfolding presents a three-state transition involving cooperative secondary and tertiary structure changes and a partially folded intermediate that can oligomerize. The first transition corresponds to unfolding of the metastable B subdomain containing the binding site for the LXCXE motif present in cellular and viral targets, and the second transition corresponds to the stable A subdomain. The low thermodynamic stability of RbAB translates into a propensity to rapidly oligomerize and aggregate at 37 °C (T50 = 28 min) that is suppressed by human papillomavirus E7 and E2F peptide ligands, suggesting that Rb is likely stabilized in vivo through binding to target proteins. We propose that marginal stability and associated oligomerization may be conserved for function as a "hub" protein, allowing the formation of multiprotein complexes, which could constitute a robust mechanism to retain its cell cycle regulatory role throughout evolution. Decreased stability and oligomerization are shared with the p53 tumor suppressor, suggesting a link between folding and function in these two essential cell regulators that are inactivated in most cancers and operate within multitarget signaling pathways.

Keywords: Cyclin Fold; Marginal Stability; Oligomerization; Protein Aggregation; Protein Folding; Protein Misfolding; Protein Stability; Retinoblastoma (Rb); Scaffold Proteins; Tumor Suppressor.


Figures

FIGURE 1.
FIGURE 1.
Structure of the RbAB domain and its LXCXE and E2F ligands. A ribbon representation of the RbAB domain (Protein Data Bank code 1N4M) indicating the relative orientations of the RbAB A and B subdomains (dark and light gray, respectively) is shown. The HPV E7(21–29) peptide containing the LXCXE motif (Protein Data Bank code 1GUX; red) binds to a conserved surface cleft located in the B subdomain, whereas the E2F-TD(407–426) peptide (Protein Data Bank code 1N4M; green) binds to a conserved groove formed by the A/B interface. The three tryptophan residues in RbAB are depicted (cyan spheres) and are located in the hydrophobic core of the A subdomain (Trp-516), in the A/B interface (Trp-563), and in the B subdomain (Trp-681). The fraction of accessible surface area for these residues is 0.41 (Trp-516), 0.00 (Trp-563), and 0.01 (Trp-681).
SCHEME 1.
SCHEME 1.
Three-state RbAB denaturation model.
SCHEME 2.
SCHEME 2.
Coupled binding and unfolding model.
SCHEME 3.
SCHEME 3.
Kinetic model for irreversible denaturation.
FIGURE 2.
FIGURE 2.
Native conformation of the RbAB domain. A, fraction of soluble RbAB protein remaining after a 1-h incubation at pH values ranging from pH 2.0 to pH 9.5. The fraction of protein remaining in solution was quantified by UV spectroscopy with the pH ranges where aggregation occurred marked as gray shaded areas. RbAB concentration was 1 μm. B, far-UV CD spectrum of the RbAB domain at pH 7.0 (full line) and 2.0 (broken line). C, ThT fluorescence emission spectrum in 100 mm citrate-Tris buffer in the presence of RbAB at pH 7.0 (full line) and 2.0 (broken line). The emission spectrum of ThT alone was subtracted from each trace. D, near-UV CD spectrum of the RbAB domain at pH 7.0 (full line) and 2.0 (broken line). Inset, RbAB tryptophan emission spectrum at pH 7.0 (full line) and 2.0 (broken line). E, ANS fluorescence emission spectrum in 100 mm citrate-Tris buffer in the presence of RbAB at pH 7.0 (full line) and 2.0 (broken line). The emission spectrum of ANS alone was subtracted from each trace. F, particle size distribution of a 10 μm RbAB sample at pH 7.0 (dark gray bars) and 2.0 (light gray bars) measured by dynamic light scattering. The average particle size populations were RS = 3.85 ± 0.07 nm (pH 7.0) and RS = 23 ± 4 nm (pH 2.0). AU, arbitrary units; deg, degrees. Error bars represent standard deviations.
FIGURE 3.
FIGURE 3.
GdmCl equilibrium unfolding of the RbAB domain. Far-UV CD spectra (A), near-UV CD spectra (B), and intrinsic tryptophan fluorescence spectra (C) of 1 μm RbAB at 0 m GdmCl (full line), 0.8 m GdmCl (dashed line), 3 m GdmCl (dashed and dotted line), and 6 m GdmCl (dotted line) are shown. D, RbAB equilibrium unfolding transition followed by monitoring molar ellipticity at 220 nm (CD; open circles) and tryptophan fluorescence CSM (black circles). Protein concentration was 1 μm. Fits for each signal obtained from Equation 4 are plotted as full lines. E, fraction of N, I, and U species as a function of GdmCl concentration plotted using Equations 5–9 and the parameters obtained from fitting of the denaturation curves (Table 1). The species populated at different GdmCl concentrations are indicated above the graph. AU, arbitrary units; deg, degrees.
FIGURE 4.
FIGURE 4.
RbAB particle size distribution at different GdmCl concentrations. Dynamic light scattering measurements of a 10 μm RbAB solution in 20 mm phosphate buffer, pH 7.0, 200 mm NaCl, and 2 mm DTT with different GdmCl concentrations. The GdmCl concentration and average Stokes radius (RS) for each condition is indicated inside each panel. Error bars represent standard deviations.
FIGURE 5.
FIGURE 5.
Urea denaturation and effect of peptide ligands on RbAB equilibrium unfolding. A, RbAB equilibrium unfolding followed by molar ellipticity at 220 nm (CD; open circles) and tryptophan fluorescence CSM (black circles). Lines are global fits to a two-state denaturation model (Equation 10 and Table 1). Protein concentration was 1 μm. B, far-UV CD spectra of 1 μm RbAB in 0.3 m urea (full line), 4.0 m urea (dashed line), 3 m GdmCl (dotted line), and 6 m GdmCl (dashed and dotted line). C, fraction of native protein as a function of urea concentration for the isolated RbAB domain (CD, open circles; CSM, black circles) and for complexes of 1 μm RbAB with 10 μm E2FTD (CD, open triangles; CSM, black triangles) and 1 μm RbAB with 10 μm E7(16–31) (CD, open diamonds; CSM, black diamonds). Lines are global fits of the CD and CSM signals to Equation 14. Parameters from global fitting are reported in Tables 1 and 2. The species populated at different urea concentrations are depicted above the graphs. deg, degrees.
FIGURE 6.
FIGURE 6.
Irreversible thermal denaturation of the RbAB domain. A, RbAB irreversible thermal denaturation scans. The far-UV CD ellipticity signal at 220 nm was recorded as temperature increased from 20 to 80 °C (open circles) or decreased from 80 to 20 °C (black circles) at a scanning speed of 3 °C/min. Protein concentration was 2 μm in a 0.1-cm-path length cell. Data were fit to Equation 16 (see “Experimental Procedures”), obtaining a Tm(app) value of 52.2 ± 0.1 °C. Residuals are shown below the graph. B, far-UV CD spectra of the RbAB domain before thermal denaturation at 20 °C (full line), at the end point of the scan at 80 °C (broken line), and after decreasing temperature to 20 °C following denaturation (dotted line). mdeg, millidegrees.
FIGURE 7.
FIGURE 7.
Isothermal denaturation kinetics of the RbAB domain. A, thermal denaturation kinetics followed after adding RbAB from a concentrated stock solution held at 4 °C to a 0.2-cm-path length cell containing buffer equilibrated at 45 °C. The final RbAB concentration was 0.5 μm. Light gray line, CD signal; black line, elastic scattering signal. B, thermal denaturation kinetics followed after adding RbAB from a concentrated stock solution held at 4 °C to a 0.2-cm-path length cell containing buffer equilibrated at 45 °C. The final RbAB concentration was 4 μm. Light gray line, CD signal; black line, elastic scattering signal. C, normalized light scattering signal as a function of time for RbAB concentrations ranging from 0.2 to 4 μm (right to left). The dashed lines indicate the area of the curves used for the nucleus size analysis. Each of the five data sets in D was obtained from time points within the dashed region. D, log-log plot of aggregate concentration as a function of free monomer concentration calculated according to Equation 17. Each data set represents values calculated for all total protein concentrations at a fixed time in the denaturation kinetics: 5 (filled circles), 10 (open circles), 15 (filled triangles), 20 (open triangles), and 25 min (filled squares). The size of the nucleus (2.3 ± 0.2) was calculated as an average of the slopes obtained for each data set. All linear fits had correlation values of r > 0.89. E, dependence of the speed of elongation (VE) on total RbAB concentration. Data points were fit to Equation 18, and the order of the reaction was obtained from the slope, which was 1.20 ± 0.01 (see “Experimental Procedures”). deg, degrees.
SCHEME 4.
SCHEME 4.
Minimal model for RbAB thermal denaturation.
FIGURE 8.
FIGURE 8.
Irreversible thermal denaturation of the RbAB domain at 37 °C and effect of LXCXE and E2F-TD peptide ligands on thermal stability. A, aggregation kinetics of the isolated RbAB domain at 37 °C and 5 μm concentration followed by light scattering (black line) and by far-UV CD (open circles) and aggregation kinetics of 5 μm RbAB in complex with 20 μm E7(16–31) peptide (dark gray line) or with 20 μm E2F-TD peptide (broken line) followed by light scattering. B, thermal scans of the isolated RbAB domain at 2 μm concentration (filled black circles; Tm(app) = 49.5 ± 0.1 °C) and of complexes of 2 μm RbAB domain with 20 μm E7(16–31) peptide (filled black triangles; Tm(app) = 60.1 ± 0.1 °C) or with 20 μm E2F-TD peptide (open black circles; Tm(app) = 58.9 ± 0.1 °C) (Table 2). Lines are fits to Equation 16. C, correlation between the binding free energy and the change in apparent melting temperature for a set of peptides containing the LXCXE motif (data are from Table 3). The line is a linear fit of the data (correlation coefficient r = 0.892). mdeg, millidegrees.
FIGURE 9.
FIGURE 9.
RbAB conformational equilibria and possible effects of ligand binding, mutation, or phosphorylation. The diagram represents the native and non-native species populated by the RbAB domain. The RbAB ligand-bound form is derived from Protein Data Bank codes 1GUX and 1N4M with the LXCXE peptide in orange and the E2F-TD peptide in red. Tumorigenic mutations located in the RbAB hydrophobic core are mapped on the RbAB structure and shown as cyan spheres. Reversible processes are represented with double arrows, and irreversible processes are represented with one-way arrows with RbAB species where the B domain is unfolded marked in blue. Gray boxes indicate conformations that may be stabilized by tumorigenic mutations. Temp, temperature.

Similar articles

Cited by

References

    1. van den Heuvel S., Dyson N. J. (2008) Conserved functions of the pRB and E2F families. Nat. Rev. Mol. Cell Biol. 9, 713–724 - PubMed
    1. Khidr L., Chen P. L. (2006) RB, the conductor that orchestrates life, death and differentiation. Oncogene 25, 5210–5219 - PubMed
    1. Macaluso M., Montanari M., Giordano A. (2006) Rb family proteins as modulators of gene expression and new aspects regarding the interaction with chromatin remodeling enzymes. Oncogene 25, 5263–5267 - PubMed
    1. Sage J. (2012) The retinoblastoma tumor suppressor and stem cell biology. Genes Dev. 26, 1409–1420 - PMC - PubMed
    1. Cross F. R., Buchler N. E., Skotheim J. M. (2011) Evolution of networks and sequences in eukaryotic cell cycle control. Philos. Trans. R. Soc. Lond. B Biol. Sci. 366, 3532–3544 - PMC - PubMed

Publication types