. 2013 Jul;41(12):6058-71.
doi: 10.1093/nar/gkt325. Epub 2013 Apr 30.

Genome conformation capture reveals that the Escherichia coli chromosome is organized by replication and transcription

Affiliations

Genome conformation capture reveals that the Escherichia coli chromosome is organized by replication and transcription

Cedric Cagliero et al. Nucleic Acids Res. 2013 Jul.

Abstract

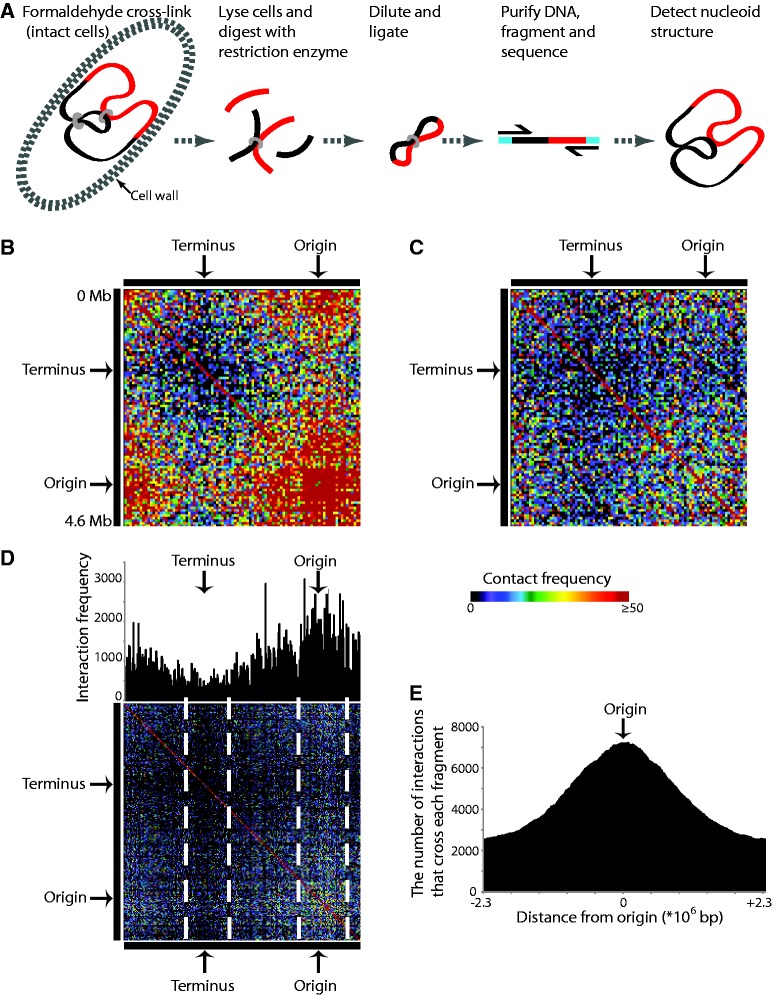
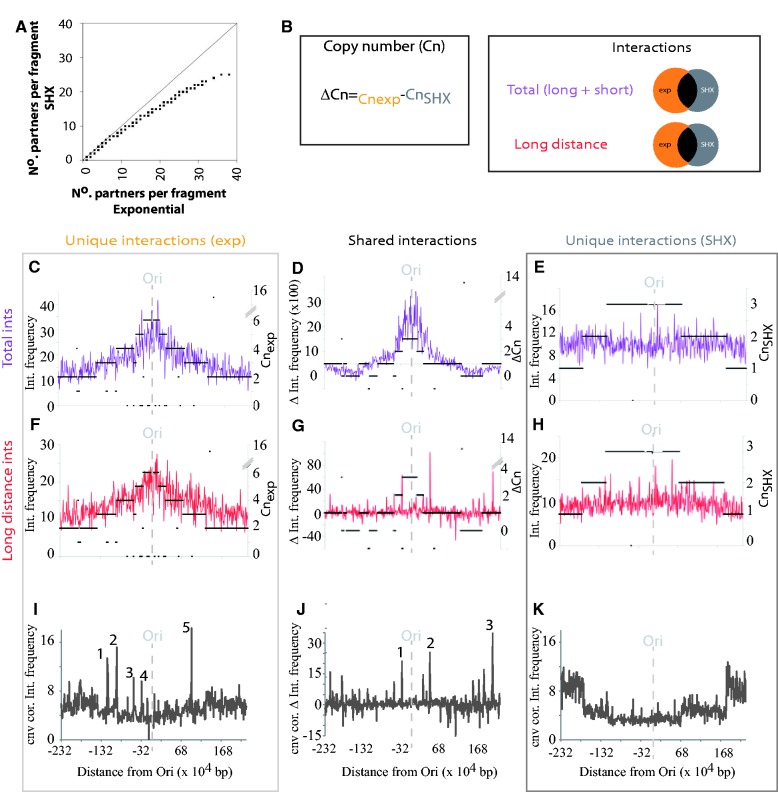
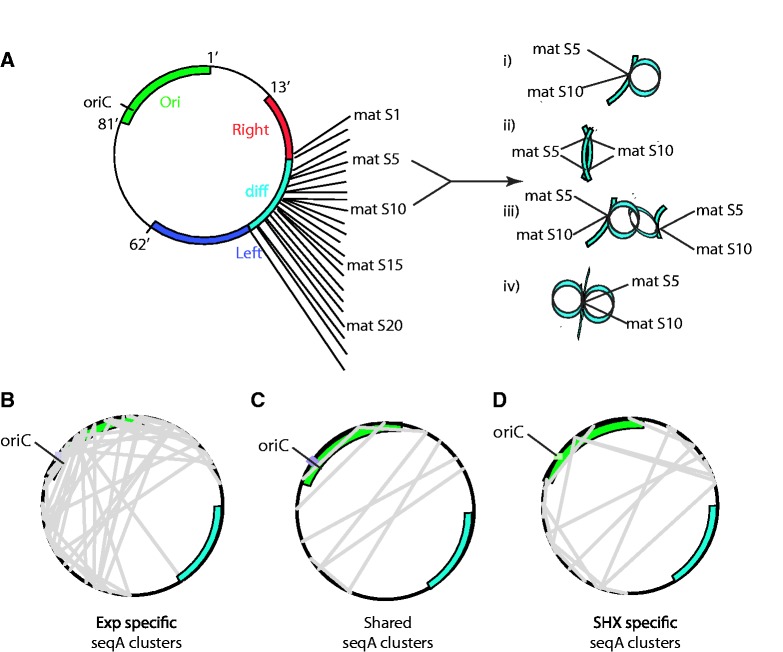
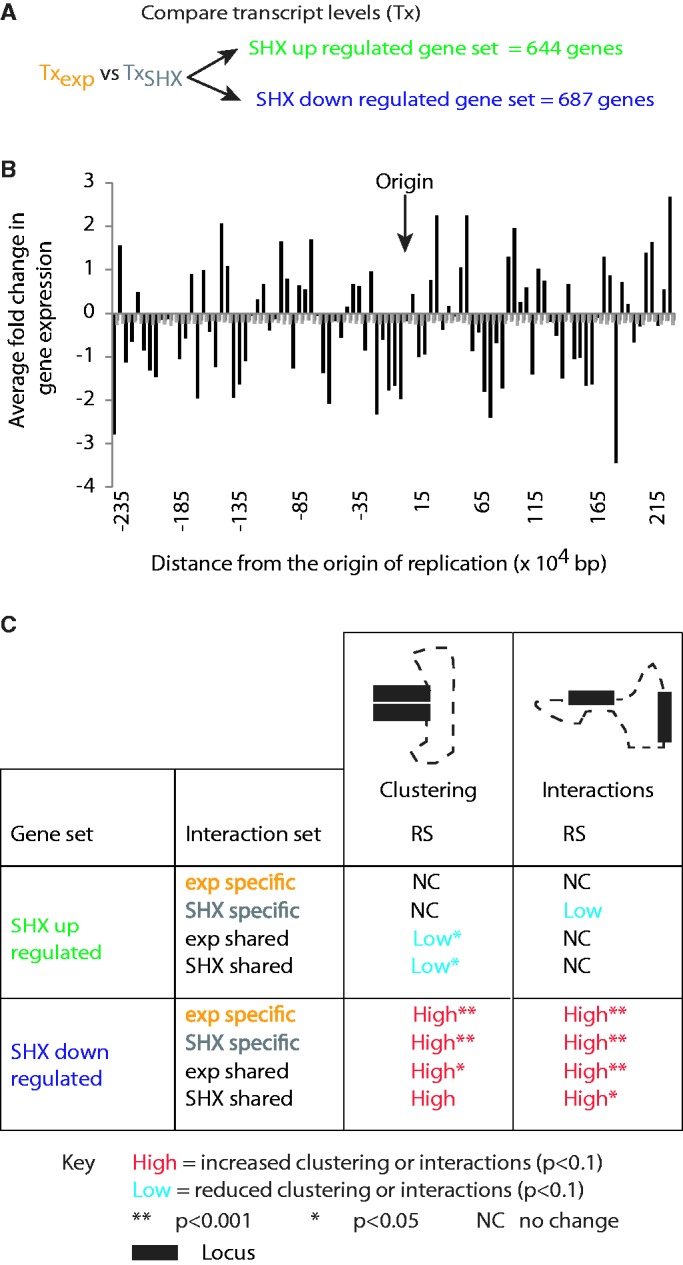
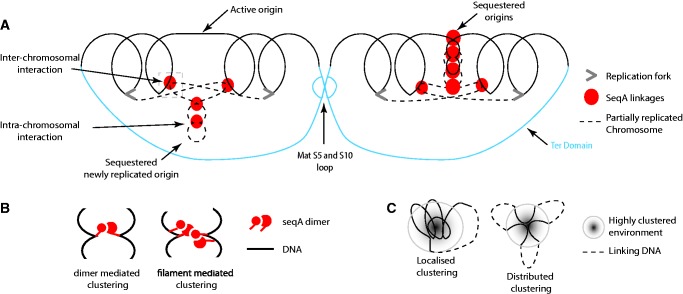
To fit within the confines of the cell, bacterial chromosomes are highly condensed into a structure called the nucleoid. Despite the high degree of compaction in the nucleoid, the genome remains accessible to essential biological processes, such as replication and transcription. Here, we present the first high-resolution chromosome conformation capture-based molecular analysis of the spatial organization of the Escherichia coli nucleoid during rapid growth in rich medium and following an induced amino acid starvation that promotes the stringent response. Our analyses identify the presence of origin and terminus domains in exponentially growing cells. Moreover, we observe an increased number of interactions within the origin domain and significant clustering of SeqA-binding sequences, suggesting a role for SeqA in clustering of newly replicated chromosomes. By contrast, 'histone-like' protein (i.e. Fis, IHF and H-NS) -binding sites did not cluster, and their role in global nucleoid organization does not manifest through the mediation of chromosomal contacts. Finally, genes that were downregulated after induction of the stringent response were spatially clustered, indicating that transcription in E. coli occurs at transcription foci.


Figures

Figure 1.
Figure 1.
Ori and Ter domains are present within the E. coli nucleoid. (A) Schematic of the GCC procedure (36). Intact cells are cross-linked with formaldehyde before lysis, and the cross-linked nucleoids are isolated. The nucleoids are restriction digested, diluted and ligated to generate an interaction library. The interaction library is sequenced, after the addition of sequencing adapters (blue bars), and the network of interactions that define the nucleoid organization is determined. (B) Genome-wide contact matrix (50-kb bins) for exponentially growing E. coli nucleoids. The matrix highlights the Ori (high contact region) and Ter domains (low contact region). (C) Genome-wide contact matrix (50-kb bins) for nucleoids isolated from SHX-treated E. coli. The Ori and Ter domains remain visible. (D) Genome-wide contact matrix (20-kb bins) and bar graph for exponentially growing nucleoids highlighting regions of low interaction frequency (‘domain boundaries’) surrounding the Ori and Ter regions. (E) Frequency of exponential phase interactions that cross each restriction fragment plotted as a function of distance from the Ori (0). Fixed boundaries are not observed. The profile for the SHX-treated cells is not different (data not shown).
Figure 2.
Figure 2.
Origin proximal interactions are more frequently detected. (A) Fragments that interact have more partners in the exponential nucleoids as opposed to SHX-treated nucleoids. The 45° line shows the expected pattern if the number of partners for each fragment is equal in both conditions. (B) Schematic of the copy number and interaction comparisons that were performed. Comparisons between interaction frequency and copy number: (C–E), total observed interactions; (F–H), long distance (>800 bp) interactions. (C) Interactions that are specific to exponential phase growth correlated with copy number. (D) Differences in frequency for shared interactions between exponentially growing and SHX-treated E. coli cells indicate a correlation with copy number. (E) Interactions that were specific to SHX-treated cells are copy number independent. (F) Exponential phase-specific long distance interactions correlated with copy number. (G) Removal of short distance interactions (≤800 bp) removed the copy number dependence of the shared interactions. (H) SHX-specific interactions were independent of copy number. (I) Correction of exponential-specific long distance interactions identifies five peaks (I1–5) of increased interactions at positions (I1) 2 753 883–2 773 883, (I2) 2 983 883–3 003 883, (I3) 3 413 883–3 423 883, (I4) 3 613 883–3 623 883 and (I5) 224 208–234 208 bp. (J) Correction of shared long distance interactions identifies three peaks (J1–3) of increased interactions at positions (J1) 3 643 883–3 653 883, (J2) 4 383 883–4 393 883 and (J3) 1 404 208–1 414 208 bp. (K) Correction of SHX-specific long distance interactions for copy number identifies a decrease in the relative frequency of interactions at the origin compared with the terminus. Interactions were tallied for 10 000-bp bins and corrected for the number of fragments per bin. Vertical, gray broken lines denote the position of the origin of replication. Copy number is depicted by black horizontal bars.
Figure 3.
Figure 3.
Binding sites for NAPs MatP and SeqA exhibit differing degrees of spatial clustering within the exponential and SHX-treated E. coli nucleoids. (A) Regions that centered on matS-binding sites [±50 bp; (5)] show significantly increased clustering in the exponential condition, despite having interaction levels that were no different from random (Supplementary Table S6). MatS site clustering is confined to two matS sites: matS5 and matS10 and may result from (A i) intra-chromosome interactions, or (A ii–iv) inter-chromosomal interactions. Critically, this clustering is not observed in the SHX-treated nucleoid. (B) Exponential-specific spatial clustering of SeqA-binding sites was concentrated around the origin. (C) Spatial clusters of SeqA-binding sites that were shared between conditions tended to occur between the left and right replichores. (D) SHX-specific interactions involved fewer SeqA-binding sites and tended to be toward the terminus (Supplementary Table S7).
Figure 4.
Figure 4.
Annotated genes with transcripts that were up- (644 genes) or down- (687 genes) regulated after SHX treatment existed in different spatial environments. (A) Genes that changed transcript level (Tx) after treatment with SHX were identified. (B) Analyses of positions of the up- and downregulated genes across the E. coli genome identify non-random clustering within the linear sequence. Average expression levels were calculated for 50-kb bins. Grey bars indicate the average expression across 50-kb bins within a thousand randomized genomes. Autocorrelation analyses on the distribution of gene expression data across the genome demonstrated a strong predictive relationship up to 32 genes away (ACF: >0.83). (C) Clustering and interaction patterns for up- or downregulated genes demonstrate that up- and downregulated genes occupy specific spatial environments. The amount of clustering within the up- or downregulated gene sets, and between the up- or downregulated genes and other loci, was compared with 1000 randomly generated sets. One thousand random sets of equivalent size (number and length) to the up- or downregulated sets were generated such that they (i) randomized the spacing between elements (RS) or (ii) conserved the linear spacing between the elements (CLS) involved in the interactions. Clustering and interaction counts were determined individually for the condition specific and shared data sets. Clustering and interaction data are shown for both exponential (exp) and SHX shared interaction sets because despite the interaction being shared, the clustering or interaction frequency was specific for each condition. There were no significant differences for comparisons with either the RS or CLS random sets. These analyses were performed on long distance interactions only.
Figure 5.
Figure 5.
Spatial model of exponential phase nucleoid organization in E. coli. (A) The exponential phase E. coli nucleoid is organized into high interacting domains by nucleoid-associated factors including, but not limited to, SeqA and MatP. SeqA promotes the intra- and inter-chromosomal clustering of hemimethylated GATC sites to sequester recently replicated origins and contribute to chromosome segregation. Newly replicated origins can be sequestered individually (left) or through interactions between the recently replicated origins (right). The matS5–10 loop is hypothesized to form between chromosomes that have almost completed replication. The model illustrates some of the major findings in the study, but for simplicity, overlap between replichores has not been included in this cartoon. Similarly, only one replication process has been illustrated on each chromosome. Moreover, as our data are drawn from an unsynchronized population, and we do not have data on the relative positions of the different elements through the cell cycle, we have not attempted to represent the dynamic nature of the positioning of the different elements throughout the cell cycle. (B) SeqA can mediate interactions within or between chromosomes as either a dimer or filament. (C) Highly clustered regions form as a result of localized and distributed clustering within and/or between the replicated chromosomes.

Similar articles

Cited by

References

    1. Woldringh CL, Nanninga N. Structural and physical aspects of bacterial chromosome segregation. J. Struct. Biol. 2006;156:273–283. - PubMed
    1. Ishihama A. The nucleoid: an overview. In: Curtiss R, Kaper JB, Squires CL, Karp PD, Neidhardt FC, Slauch JM, editors. EcoSal. Washington, DC: ASM Press; 2009.
    1. Sherratt DJ. Bacterial chromosome dynamics. Science. 2003;301:780–785. - PubMed
    1. Liu X, Wang X, Reyes-Lamothe R, Sherratt D. Replication-directed sister chromosome alignment in Escherichia coli. Mol. Microbiol. 2010;75:1090–1097. - PMC - PubMed
    1. Mercier R, Petit MA, Schbath S, Robin S, El Karoui M, Boccard F, Espeli O. The MatP/matS site-specific system organizes the terminus region of the E. coli chromosome into a macrodomain. Cell. 2008;135:475–485. - PubMed

Publication types

MeSH terms