Characterization of drug-induced transcriptional modules: towards drug repositioning and functional understanding
- PMID: 23632384
- PMCID: PMC3658274
- DOI: 10.1038/msb.2013.20
Characterization of drug-induced transcriptional modules: towards drug repositioning and functional understanding
Abstract
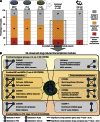
In pharmacology, it is crucial to understand the complex biological responses that drugs elicit in the human organism and how well they can be inferred from model organisms. We therefore identified a large set of drug-induced transcriptional modules from genome-wide microarray data of drug-treated human cell lines and rat liver, and first characterized their conservation. Over 70% of these modules were common for multiple cell lines and 15% were conserved between the human in vitro and the rat in vivo system. We then illustrate the utility of conserved and cell-type-specific drug-induced modules by predicting and experimentally validating (i) gene functions, e.g., 10 novel regulators of cellular cholesterol homeostasis and (ii) new mechanisms of action for existing drugs, thereby providing a starting point for drug repositioning, e.g., novel cell cycle inhibitors and new modulators of α-adrenergic receptor, peroxisome proliferator-activated receptor and estrogen receptor. Taken together, the identified modules reveal the conservation of transcriptional responses towards drugs across cell types and organisms, and improve our understanding of both the molecular basis of drug action and human biology.
Conflict of interest statement
The authors declare that they have no conflict of interest.
Figures


Similar articles
-
Identification of transcription factors for drug-associated gene modules and biomedical implications.Bioinformatics. 2014 Feb 1;30(3):305-9. doi: 10.1093/bioinformatics/btt683. Epub 2013 Nov 20. Bioinformatics. 2014. PMID: 24262216
-
Comparative analysis of acute and chronic corticosteroid pharmacogenomic effects in rat liver: transcriptional dynamics and regulatory structures.BMC Bioinformatics. 2010 Oct 14;11:515. doi: 10.1186/1471-2105-11-515. BMC Bioinformatics. 2010. PMID: 20946642 Free PMC article.
-
Repositioning drugs by targeting network modules: a Parkinson's disease case study.BMC Bioinformatics. 2017 Dec 28;18(Suppl 14):532. doi: 10.1186/s12859-017-1889-0. BMC Bioinformatics. 2017. PMID: 29297292 Free PMC article.
-
Pharmacogenomics, regulation and signaling pathways of phase I and II drug metabolizing enzymes.Curr Drug Metab. 2002 Oct;3(5):481-90. doi: 10.2174/1389200023337171. Curr Drug Metab. 2002. PMID: 12369894 Review.
-
Pharmacogenomics of cardiovascular pharmacology: development of an informatics system for analysis of DNA microarray data with a focus on lipid metabolism.J Pharmacol Sci. 2008 May;107(1):1-7. doi: 10.1254/jphs.08r02fm. J Pharmacol Sci. 2008. PMID: 18490852 Review.
Cited by
-
A survey on the computational approaches to identify drug targets in the postgenomic era.Biomed Res Int. 2015;2015:239654. doi: 10.1155/2015/239654. Epub 2015 Apr 28. Biomed Res Int. 2015. PMID: 26060814 Free PMC article. Review.
-
A platform for target prediction of phenotypic screening hit molecules.J Mol Graph Model. 2020 Mar;95:107485. doi: 10.1016/j.jmgm.2019.107485. Epub 2019 Oct 24. J Mol Graph Model. 2020. PMID: 31836397 Free PMC article.
-
Agent Clustering Strategy Based on Metabolic Flux Distribution and Transcriptome Expression for Novel Drug Development.Biomedicines. 2021 Nov 8;9(11):1640. doi: 10.3390/biomedicines9111640. Biomedicines. 2021. PMID: 34829869 Free PMC article.
-
Characterization of chemically induced liver injuries using gene co-expression modules.PLoS One. 2014 Sep 16;9(9):e107230. doi: 10.1371/journal.pone.0107230. eCollection 2014. PLoS One. 2014. PMID: 25226513 Free PMC article.
-
A transcriptomics data-driven gene space accurately predicts liver cytopathology and drug-induced liver injury.Nat Commun. 2017 Jul 3;8:15932. doi: 10.1038/ncomms15932. Nat Commun. 2017. PMID: 28671182 Free PMC article.
References
-
- Andersen AH, Hvidberg E (1981) [New classification of drugs: ATC-code introduced]. Sygeplejersken 81: 24–26 - PubMed
-
- Ashburner M, Ball CA, Blake JA, Botstein D, Butler H, Cherry JM, Davis AP, Dolinski K, Dwight SS, Eppig JT, Harris MA, Hill DP, Issel-Tarver L, Kasarskis A, Lewis S, Matese JC, Richardson JE, Ringwald M, Rubin GM, Sherlock G (2000) Gene ontology: tool for the unification of biology. The Gene Ontology Consortium. Nat Genet 25: 25–29 - PMC - PubMed
-
- Barretina J, Caponigro G, Stransky N, Venkatesan K, Margolin AA, Kim S, Wilson CJ, Lehár J, Kryukov G V., Sonkin D, Reddy A, Liu M, Murray L, Berger MF, Monahan JE, Morais P, Meltzer J, Korejwa A, Jané-Valbuena J, Mapa FA et al. (2012) The Cancer Cell Line Encyclopedia enables predictive modelling of anticancer drug sensitivity. Nature 483: 603–307 - PMC - PubMed
-
- Bartz F, Kern L, Erz D, Zhu M, Gilbert D, Meinhof T, Wirkner U, Erfle H, Muckenthaler M, Pepperkok R, Runz H (2009) Identification of cholesterol-regulating genes by targeted RNAi screening. Cell Metab 10: 63–75 - PubMed
MeSH terms
Substances
LinkOut - more resources
Full Text Sources
Other Literature Sources

