. 2013 May 28;108(10):2021-32.
doi: 10.1038/bjc.2013.187. Epub 2013 Apr 30.

Metformin inhibits growth and enhances radiation response of non-small cell lung cancer (NSCLC) through ATM and AMPK

Affiliations

Metformin inhibits growth and enhances radiation response of non-small cell lung cancer (NSCLC) through ATM and AMPK

Y Storozhuk et al. Br J Cancer. .

Abstract

Background: We examined the potential of metformin (MET) to enhance non-small cell lung cancer (NSCLC) responses to ionising radiation (IR).

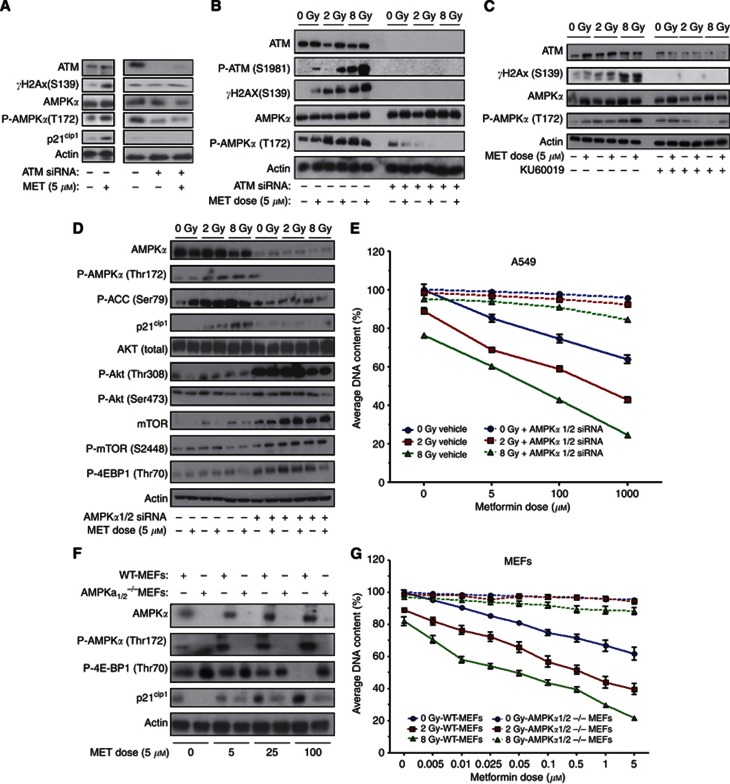
Methods: Human NSCLC cells, mouse embryonic fibroblasts from wild-type and AMP-activated kinase (AMPK) α1/2-subunit(-/-) embryos (AMPKα1/2(-/-)-MEFs) and NSCLC tumours grafted into Balb/c-nude mice were treated with IR and MET and subjected to proliferation, clonogenic, immunoblotting, cell cycle and apoptosis assays and immunohistochemistry (IHC).

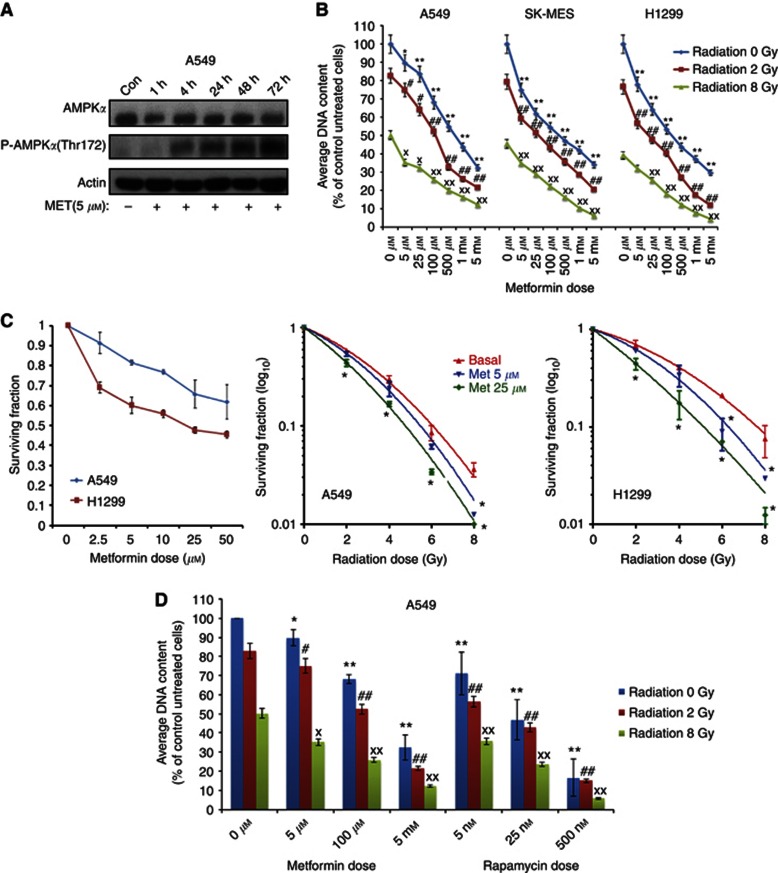
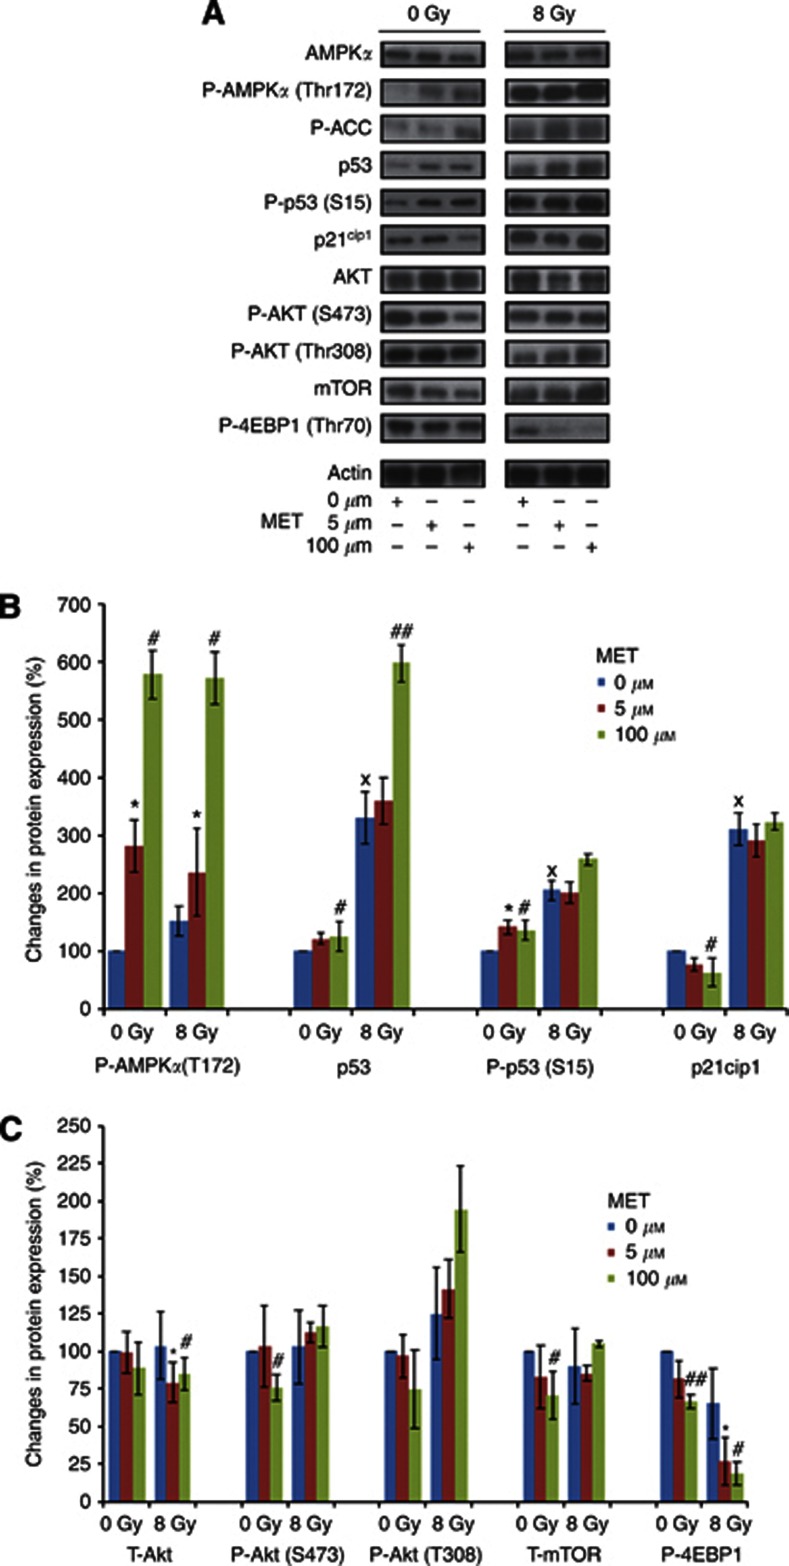
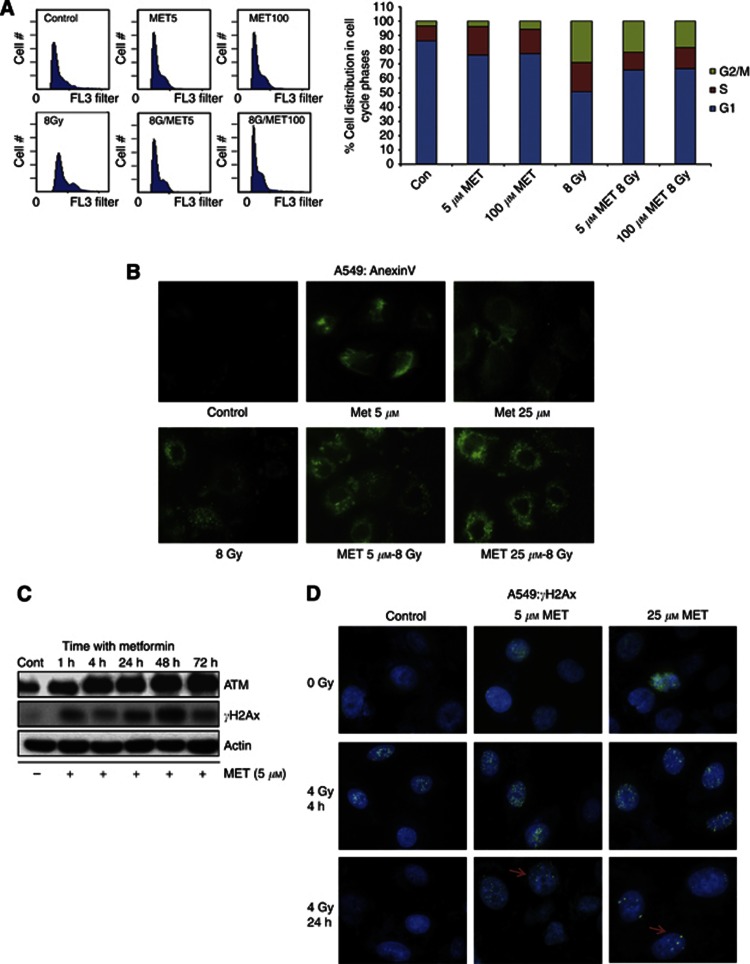
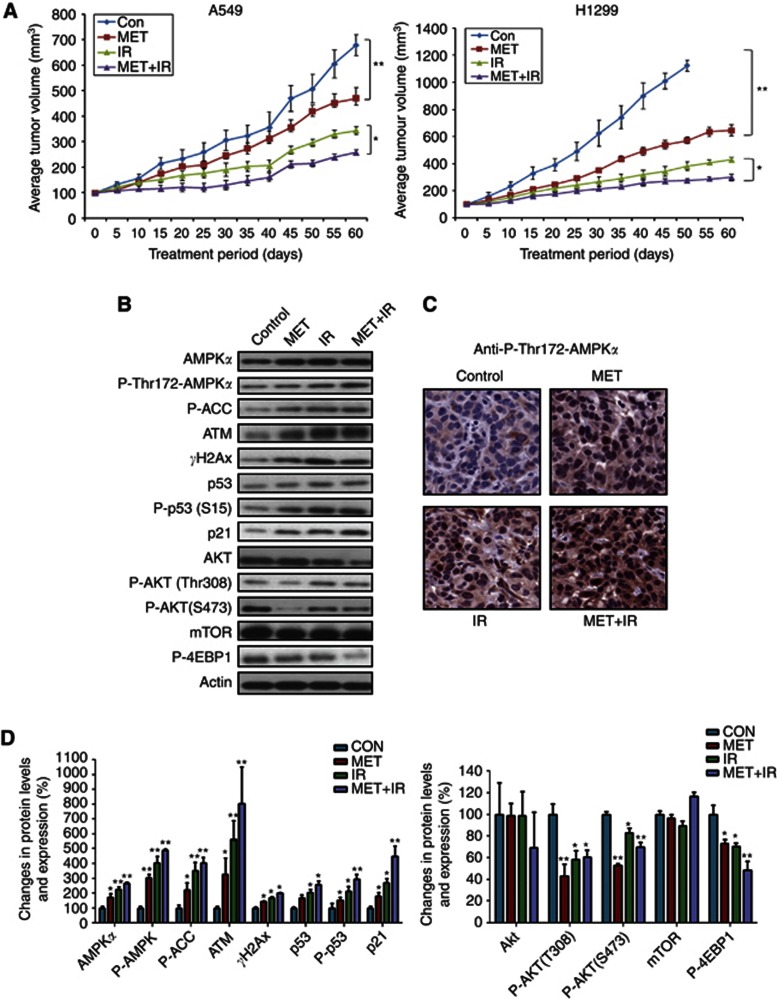
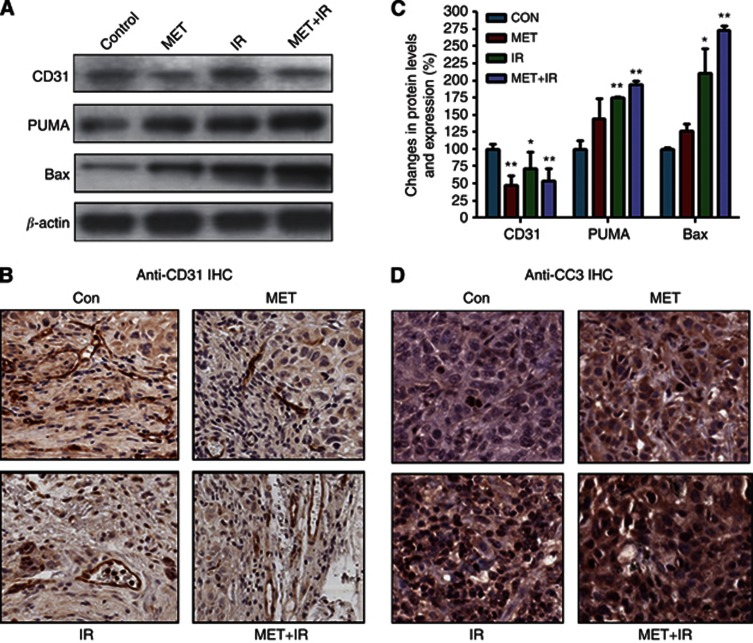
Results: Metformin (2.5 μM-5 mM) inhibited proliferation and radio-sensitised NSCLC cells. Metformin (i) activated the ataxia telengiectasia-mutated (ATM)-AMPK-p53/p21(cip1) and inhibited the Akt-mammalian target of rapamycin (mTOR)-eIF4E-binding protein 1 (4EBP1) pathways, (ii) induced G1 cycle arrest and (iii) enhanced apoptosis. ATM inhibition blocked MET and IR activation of AMPK. Non-small cell lung cancer cells with inhibited AMPK and AMPKα1/2(-/-)-MEFs were resistant to the antiproliferative effects of MET and IR. Metformin or IR inhibited xenograft growth and combined treatment enhanced it further than each treatment alone. Ionising radiation and MET induced (i) sustained activation of ATM-AMPK-p53/p21(cip1) and inhibition of Akt-mTOR-4EBP1 pathways in tumours, (ii) reduced expression of angiogenesis and (iii) enhanced expression of apoptosis markers.

Conclusion: Clinically achievable MET doses inhibit NSCLC cell and tumour growth and sensitise them to IR. Metformin and IR mediate their action through an ATM-AMPK-dependent pathway. Our results suggest that MET can be a clinically useful adjunct to radiotherapy in NSCLC.


Figures

Figure 1
Figure 1
Effects of MET and IR on proliferation, clonogenic survival and molecular signals in human LC cells. (A) Time course of MET effects on the pathways of AMPK. Cells were treated with 5 μℳ MET doses for 1–72 h, lysed and probed with anti-total and -P-AMPK (T172) and -actin antibodies. Representative immunoblots from three experiments are shown. (B) A549, SK-MES1 and H1299 human LC cells were treated with increasing MET doses (5 μmol–5 mℳ) for 24 h before treatment with 0, 2 or 8 Gy IR. Cells were fixed 48 h later. Proliferation results (mean±s.e.) of three independent experiments (including six replicates per condition in each experiment) are shown. Statistically significant differences compared with corresponding control cells (not treated with MET) within the 0, 2 and 8 Gy IR treatment groups are shown (*P< 0.05, **P<0.001 for 0 Gy group; #P<0.05, ##P<0.001 for 2 Gy group; xP<0.05 and xxP<0.001 for 8 Gy group respectively). (C) Metformin and IR reduced clonogenic survival of LC cells. A549 and H1299 LC cells were first treated with increasing doses of MET (0–50 μℳ) and subsequently with combination of 0, 5 or 25 μℳ MET and 0–8 Gy IR dose. Clonogenic survival was determined as outlined in Materials and Methods. Data were fitted into the linear quadratic model. Average results of three independent experiments are shown (* indicates statistical significance at P<0.05). (D) Comparison of MET and rapamycin effects in combination with IR on A549 human LC cell proliferation. Cells were treated with either 5 μℳ, 100 μℳ or 5 mℳ MET or 5, 25 and 500 nℳ rapamycin for 24 h, followed by treatment with either 0, 2 or 8 Gy of IR and incubation for an additional 24 h. Cells were fixed and proliferation rate was determined as outlined in (A). Results of 3–4 independent experiments (mean±s.e.) are shown. Statistically significant differences of MET or rapamycin treatments from no-drug treatment control in the same radiation dose group are shown: *P<0.05; **P<0.001 for 0 Gy group; #P<0.05; ##P<0.001 for 2 Gy group; xP<0.05; xxP<0.001 for 8 Gy treatment group.
Figure 2
Figure 2
Metformin and IR mediate sustained modulation of molecular tumour growth and suppression pathways. A549 cells were treated with either MET (0, 5 or 100 μmol) for 48 h, IR (0, 8 Gy) for 24 h or combined MET+IR treatments. Cells were washed and lysed. Lysates were analysed with immunoblotting using indicated antibodies. (A) Representative immunoblots are shown. (B and C) Mean±s.e. densitometric quantification values from three independent immunoblotting experiments are shown for markers of the AMPK–p53–p21cip1 and the Akt–mTOR–4EBP1 pathways, respectively. (xP<0.05 between 0 μℳ MET treatment groups (0 Gy vs 8 Gy); #P<0.05, ##P<0.001 between 5 μℳ MET group (0 Gy vs 8 Gy). *P<0.05 compared to cells not treated with MET in the same IR group, respectively).
Figure 3
Figure 3
Modulation of cell cycle, apoptosis and DDR by MET and IR. (A) Cell cycle regulation by MET and IR. A549 cells were treated with 0, 5 or 100 μℳ MET for 24 h before being subjected to either 0 or 8 Gy IR for additional 48 h. Cells were fixed with ethanol and analysed by flow cytometry, as described in Materials and Methods. Representative images are shown. Graph shows results from three independent experiments. (B) Induction of apoptosis by MET and IR. Cells were treated with the indicated concentrations of MET for 48 h and exposure to 0 or 8 Gy IR. Twenty-four hours later, cells were fixed and labelled with an anti-Annexin-V antibody, and visualised under a fluorescent microscope. Representative images from two independent experiments are shown. (C) Response of the DDR pathway to MET treatment. A549 cells were treated with 5 μℳ MET for a period of 1–72 h, after which cells were lysed and lysates were probed with indicated antibodies. Representative immunoblots of four independent experiments are shown. (D) Induction of γH2AX foci by MET and IR. Cells were treated with the indicated concentrations of MET 24 h before 4 Gy IR. Following the indicated times after IR, cells were fixed and stained with DAPI (blue) and an antibody against γH2Ax (green) and visualised at × 40. Representative images of multiple fields are shown for each treatment group.
Figure 4
Figure 4
Role of ATM and AMPK in the signalling and antiproliferative effects of MET and IR. (AC) Ataxia telengiectasia-mutated regulates AMPK in response to MET and IR. A549 cells were either transfected with ATM-specific siRNA or control vector and incubated for 72 h (B) or incubated with the ATM-specific inhibitor KU60019 or vehicle for a period of 24 h (C), before treatment with 5 μℳ MET for 48 h (A–C) and/or IR of 0, 2 or 8 Gy 24 h (C) after initiation of MET treatment. After treatments, cells were washed, lysed and probed with indicated antibodies. Representative immunoblots of three independent experiments are shown. AMP-activated kinase mediates the signalling and antiproliferative effects of MET and IR. A549 cells were pretreated with siRNAs against (D) AMPKα1 and AMPKα2 catalytic subunits or control vector for a period of 72 h before treatment with 5 μℳ MET for a 48-h period and/or IR dose of 0, 2 or 8 Gy for a 24-h period. After treatment, cells were washed, lysed and probed with indicated antibodies. Representative immunoblots of three independent experiments are shown. (E) A549 cells were pretreated with control vector (vehicle) or siRNA sequences against AMPKα1 and AMPKα2 catalytic subunits for a period of 72 h before a 48-h treatment with MET (0 μℳ–1 mℳ) and a 24-h treatment with 0, 2 or 8 Gy dose of IR. Proliferation results (mean±s.e.) of three independent experiments (six replicates per condition in each experiment) are shown. (F) WT and AMPKα1/2−/−-MEFs were treated with MET (0 μℳ–100 μℳ) for a period of 48 h. After treatment, cells were washed, lysed and probed with indicated antibodies. Representative immunoblots of three independent experiments are shown. (G) WT and AMPKα1/2−/−-MEFs were treated with MET (0 μℳ–5 mℳ) for a period of 48 h and/or the indicated doses of IR for 24 h. Proliferation results (mean±s.e.) of three independent experiments are shown.
Figure 5
Figure 5
Inhibition of growth and molecular effects of MET and IR in human LC xenografts. (A) Effects on xenograft growth. Twenty-four and sixteen male Balb/c-nude mice were grafted into the right flank with 1 × 10⁶ A549 or H1299 cells respectively. Treatment with MET, IR or combination was initiated once tumour volume reached 100 mm3. Tumour volume was measured every 5 days for a period of 8 weeks, as described in Materials and Methods. Average tumour volume data of four or six animals per treatment group are shown (mean±s.e.). Final tumour volumes were: A549: control: 679.5±50.6 mm3, MET: 470.53±35.2 mm3, IR: 342.9±21.8 mm3 and MET+IR: 257.9±15.2 mm3 and H1299: control: 1129.39±39.17 mm3, MET: 646.02±40.43 mm3, IR: 428.02±18.89 mm3 and MET+IR: 300.25±24.25 mm3. Statistically significant differences between the indicated treatment groups (*P<0.05 and **P<0.001). (B) Effects of MET and IR treatments on expression and activation of molecular markers. Tumours collected from control (CON), MET, IR and MET+IR treatment groups of A549 cohort were subjected to lysis and immunoblotting with antibodies against the indicated markers. Representative immunoblots of three independent experiments are shown. (C) Immunohistochemical analysis of P-AMPK expression. Analysis of A549 tumours from four different treatment groups using an anti-P-AMPKα (Thr172) antibody. Representative images from three independent experiments are shown. (D) Densitometric analysis of immunoblotting experiments (n=6 in each group). Data are presented as mean±s.e. of normalised densitometry values. *P⩽0.05; **P⩽0.001 statistically significant difference between treatment groups and control for each marker.
Figure 6
Figure 6
Metformin and IR reduce microvessels and enhance apoptosis markers in A549 LC tumours. (A) Effects on apoptosis markers. Lysates from control, MET-, IR- and MET+IR-treated tumours were analysed with immunoblotting using anti-CD31, -Puma, -Bax and -actin antibodies. Representative immunoblots are shown. (B) Representative images of anti-CD31 IHC analysis of A549 control (CON), MET-, IR- and MET+IR-treated tumours. (C) Densitometric analysis of immunoblotting results from lysates of tumours in all experimental groups (n=6 in each group). Data are mean±s.e. of normalised densitometry values (*, P⩽0.05; **, P⩽0.001 statistically significant difference between treatment groups and control for each marker). (D) Effects MET and IR on expression of CC3. Representative images of IHC analysis of control (CON), MET-, IR- and MET+IR-treated tumours with an anti-CC3 antibody.

References

    1. Ben Sahra I, Laurent K, Loubat A, Giorgetti-Peraldi S, Colosetti P, Auberger P, Tanti JF, Le Marchand-Brustel Y, Bost F. The antidiabetic drug metformin exerts an antitumoral effect in vitro and in vivo through a decrease of cyclin D1 level. Oncogene. 2008;27:3576–3586. - PubMed
    1. Bowker SL, Majumdar SR, Veugelers P, Johnson JA. Increased cancer-related mortality for patients with type 2 diabetes who use sulfonylureas or insulin: Response to Farooki and Schneider. Diabetes Care. 2006;29:1990–1991. - PubMed
    1. Brachmann S, Fritsch C, Maira SM, Garcia-Echeverria C. PI3K and mTOR inhibitors: a new generation of targeted anticancer agents. Curr Opin Cell Biol. 2009;21:194–198. - PubMed
    1. Bussink J, van der Kogel AJ, Kaanders JH. Activation of the PI3-K/AKT pathway and implications for radioresistance mechanisms in head and neck cancer. Lancet Oncol. 2008;9:288–296. - PubMed
    1. Buzzai M, Jones RG, Amaravadi RK, Lum JJ, DeBerardinis RJ, Zhao F, Viollet B, Thompson CB. Systemic treatment with the antidiabetic drug metformin selectively impairs p53-deficient tumor cell growth. Cancer Res. 2007;67:6745–6752. - PubMed

Publication types

MeSH terms