. 2013 Jun 20;121(25):5068-77.
doi: 10.1182/blood-2012-10-460170. Epub 2013 Apr 30.

GM-CSF-dependent pSTAT5 sensitivity is a feature with therapeutic potential in chronic myelomonocytic leukemia

Affiliations

GM-CSF-dependent pSTAT5 sensitivity is a feature with therapeutic potential in chronic myelomonocytic leukemia

Eric Padron et al. Blood. .

Abstract

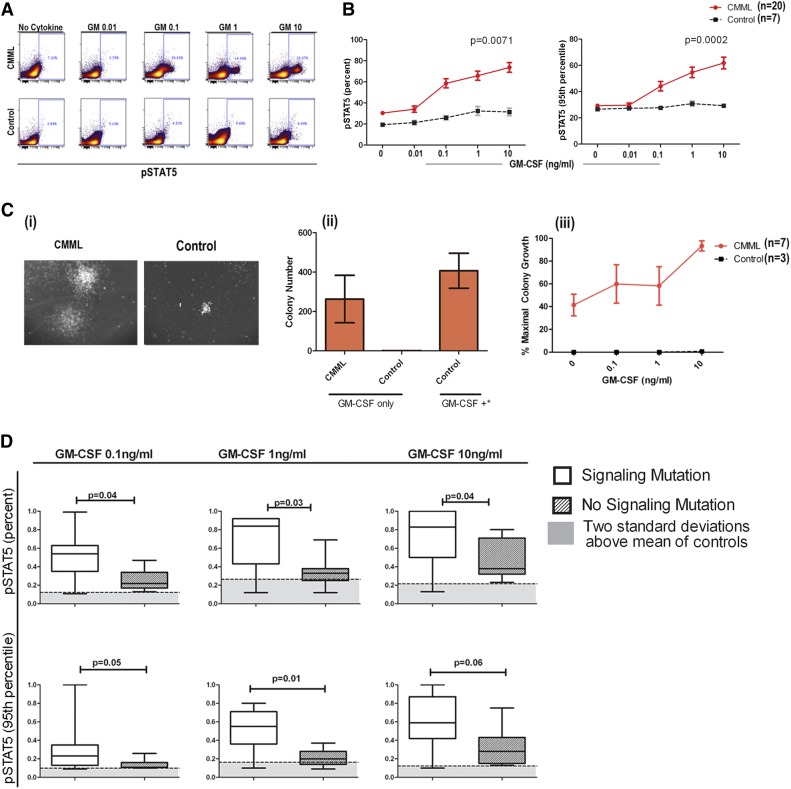
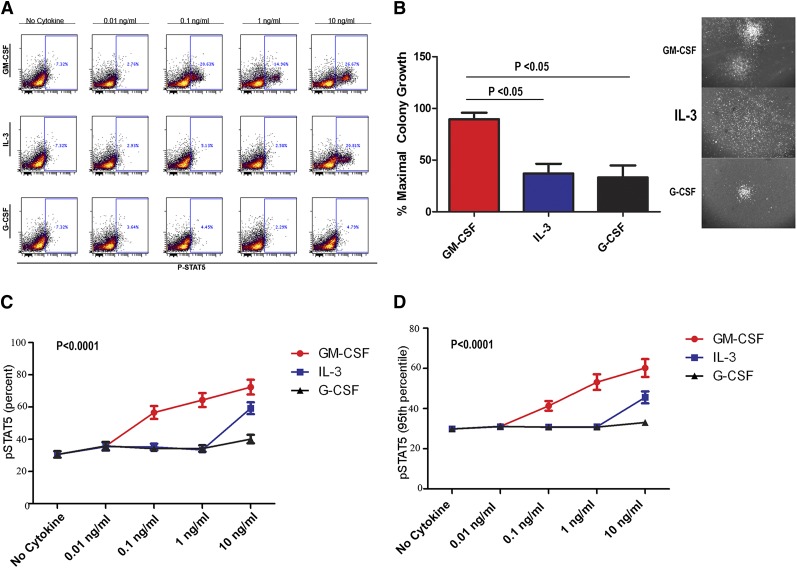
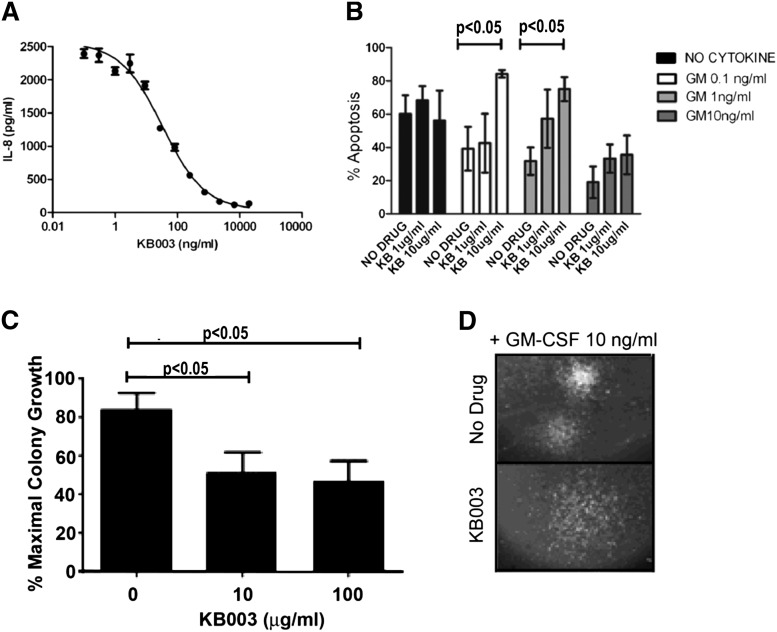
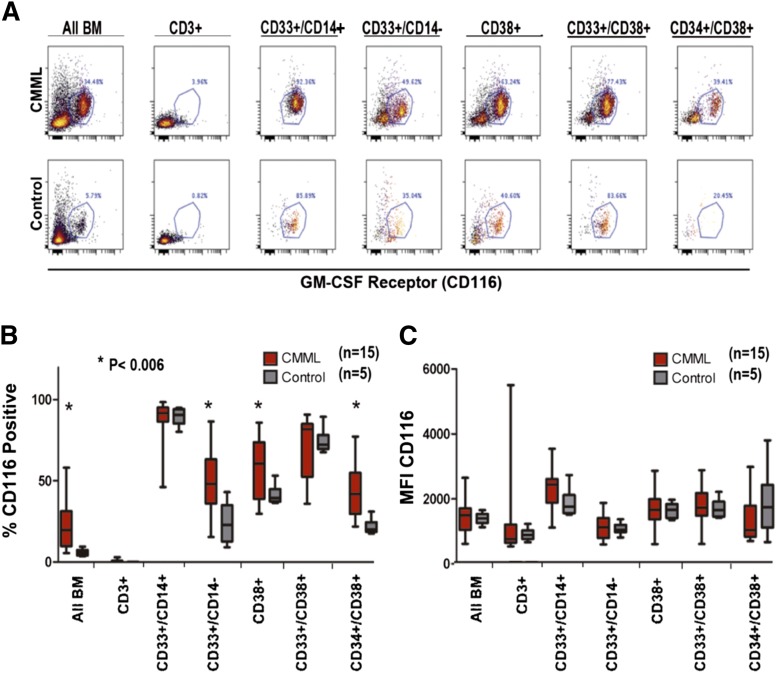
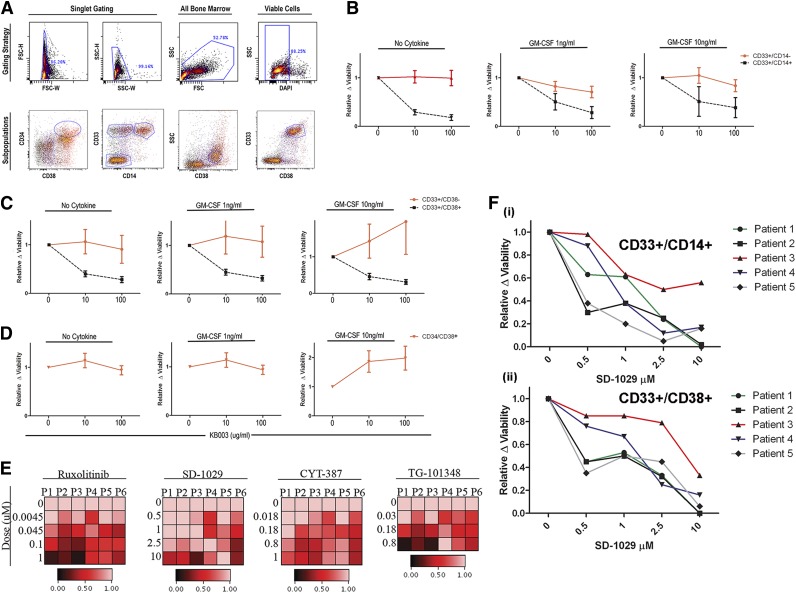
Granulocyte-macrophage-colony-stimulating factor (GM-CSF) hypersensitivity is a hallmark of juvenile myelomonocytic leukemia (JMML) but has not been systematically shown in the related human disease chronic myelomonocytic leukemia (CMML). We find that primary CMML samples demonstrate GM-CSF-dependent hypersensitivity by hematopoietic colony formation assays and phospho-STAT5 (pSTAT5) flow cytometry compared with healthy donors. Among CMML patients, the pSTAT5 hypersensitive response positively correlated with high-risk disease, peripheral leukocytes, monocytes, and signaling-associated mutations. When compared with IL-3 and G-CSF, GM-CSF hypersensitivity was cytokine specific and thus a possible target for intervention in CMML. To explore this possibility, we treated primary CMML cells with KB003, a novel monoclonal anti-GM-CSF antibody, and JAK2 inhibitors. We found that an elevated proportion of immature GM-CSF receptor-α(R) subunit-expressing cells were present in the bone marrow myeloid compartment of CMML. In survival assays, we found that myeloid and monocytic progenitors were sensitive to GM-CSF signal inhibition. Our data indicate that a committed myeloid precursor expressing CD38 may represent the progenitor population with enhanced GM-CSF dependence in CMML, consistent with results in JMML. These preclinical data indicate that GM-CSF signaling inhibitors merit further investigation in CMML and that GM-CSFR expression on myeloid progenitors may be a biomarker for this therapy.


Figures

Figure 1
Figure 1
GM-CSF–dependent pSTAT5 hypersensitivity is a feature of CMML. (A) As shown in a representative CMML sample and healthy control sample stimulated with increasing doses of GM-CSF, a distinct population of CMML primary cells becomes pSTAT5-positive at 0.1 ng/mL of GM-CSF, which does not occur in normal controls. The percentage of positive cells is indicated on the flow cytometry dot plot. (B) Bone marrow samples from 20 unique CMML patients (solid red line) were compared with 7 normal healthy controls (broken black line) after treatment with increasing doses of GM-CSF (0.01, 0.1, 1, and 10 ng/mL). All pSTAT5 flow cytometry data are expressed relative to the maximal cellular response. Data were normalized using square root transformation. P values are indicated where significant differences were detected using linear regression analysis. (Ci) Representative colonies from a CMML sample and normal control after treatment with 10 ng/mL of GM-CSF only. (Cii) Bar graph of colony numbers generated from CMML (n = 7) and healthy donors (n = 3) with GM-CSF (10 ng/mL) alone. As a positive control, GM-CSF (MethoCult H4034 Optimum), IL-6, IL-3, erythropoietin, and stem cell factor (GM-CSF+*) were added to demonstrate the capacity for colony formation by healthy control bone marrow. (Ciii) Spontaneous colonies without the addition of GM-CSF (0 ng/mL of GM-CSF) and the percent maximum colony-forming units in the presence of GM-CSF alone at increasing doses (0.1, 1, and 10 ng/mL) from CMML patients (solid red line) and controls (broken black line). Error bars represent standard error of the mean in each group. (D) Samples were placed in the signaling mutation group if a mutation in CBL (n = 5), JAK2 (n = 0), KRAS (n = 0), and/or NRAS (n = 2) was identified (n = 7). GM-CSF–dependent pSTAT5 response was compared with those without a signaling mutation (n = 11).
Figure 2
Figure 2
GM-CSF–dependent pSTAT5 hypersensitivity is cytokine-specific. (A) Representative flow dot plots from CMML samples stimulated with GM-CSF, IL-3, or G-CSF at 0.01, 0.1, 1, and 10 ng/mL. The percentage of pSTAT5-positive cells is indicated in each dot plot. (B) Representative colonies in methyl cellulose generated after treatment with G-CSF, IL-3, and GM-CSF at 10 ng/mL alone. (C) Percentage and (D) 95th FI of pSTAT5-positive cells from CMML patients treated with increasing doses (0.01, 0.1, 1, and 10 ng/mL) of GM-CSF, IL-3, or G-CSF. All pSTAT5 flow cytometry data are expressed as fold change from the cohort’s highest pSTAT5 level. Data were normalized using square root transformation. Significant P values are indicated using linear regression analysis.
Figure 3
Figure 3
KB003 effectively neutralizes GM-CSF. (A) Inhibition of GM-CSF–induced IL-8 secretion from U937 cells. KB003 at various concentrations was incubated with U937 cells in the presence of 0.5 ng/mL GM-CSF for 16 hours (a concentration of GM-CSF providing 90% of maximal induction). IL-8 secreted into the culture supernatant was determined by enzyme-linked immunosorbent assay. Results from a representative assay carried out in triplicate are shown. Mean IC50 from 3 independent assays was 48.2 ng/mL. (B) MO7e human cells were cultured with doses of GM-CSF ranging from 0 to 10 ng/mL and increasing doses of KB003. Annexin V was used to measure apoptosis and viability at 48 hours. (C) Three distinct CMML patient aspirates cultured with GM-CSF (10 ng/mL) and increasing doses of KB003. Clusters of cells of >50 were measured. (D) Representative hematopoietic colony with and without KB003. Colonies appear less organized in the drug-treated group. Significant P values are indicated using one-way analysis of variance.
Figure 4
Figure 4
GM-CSFR (CD116) expression on BM-MNCs in CMML vs control. (A) Dot plot of a representative CMML sample and healthy control stained with anti-CD116 and analyzed by multicolor flow cytometry. (B) Fifteen unique CMML samples and 5 healthy controls gated by myeloid subpopulation (CD 3+negative control) and stained with anti-CD116 measured by (C) the percent positive CD116 cells (D) and the mean fluorescent intensity of CD116. Significant P values are indicated using a paired Student t test.
Figure 5
Figure 5
KB003 impacts in vitro decreases in proliferation and viability in monocytic precursors. (A) The flow cytometry gating strategy used to determine the viability of specific subpopulations in each CMML sample is shown. Immature myeloids were defined as CD33-positive and CD14-negative. Immature monocytes were defined as CD33-positive and CD14-positive. Myeloid progenitor cells were further analyzed using CD34 and CD38 as shown. (B-D) Ten different CMML patient samples were tested (each in duplicate) to determine the viability of CMML subpopulations in the presence of increasing doses of KB003 and GM-CSF. Only viable cells were considered in the analysis, and all data were normalized to the no drug–treated group. Myeloid subpopulations were grouped as shown, and a one-way analysis of variance was done to compare the percentage of cells within the viable gate at each dose of KB003. Significant P values represent a comparison within each subpopulation. (E) A heat map was generated using DMSO (0) and increasing doses (as shown) to each individual JAK2 inhibitor (ruxolitinib, SD-1029, CYT-387, TG-101348). The percentage of GM-CSF (10 ng/mL)–dependent pSTAT5-responsive cells as measured by flow cytometry is shown relative to the maximal GM-CSF response in the presence of DMSO (drug vehicle control). Six individual CMML patient samples were analyzed (P1-P6). (F) Dose-response curves for 5 CMML BM-MNC subsets CD33+/CD14+ (Fi) and CD33+/CD38+ (Fii) treated for 48 hours with a representative JAK2 inhibitor (SD-1029). Viability is relative to the DMSO drug vehicle control and was measured using a viability stain (DAPI) by flow cytometry.

References

    1. Emanuel PD. Juvenile myelomonocytic leukemia and chronic myelomonocytic leukemia. Leukemia. 2008;22(7):1335–1342. - PubMed
    1. Rollison DE, Howlader N, Smith MT, et al. Epidemiology of myelodysplastic syndromes and chronic myeloproliferative disorders in the United States, 2001-2004, using data from the NAACCR and SEER programs. Blood. 2008;112(1):45–52. - PubMed
    1. Jankowska AM, Makishima H, Tiu RV, et al. Mutational spectrum analysis of chronic myelomonocytic leukemia includes genes associated with epigenetic regulation: UTX, EZH2, and DNMT3A. Blood. 2011;118(14):3932–3941. - PMC - PubMed
    1. Kohlmann A, Grossmann V, Klein H-U, et al. Next-generation sequencing technology reveals a characteristic pattern of molecular mutations in 72.8% of chronic myelomonocytic leukemia by detecting frequent alterations in TET2, CBL, RAS, and RUNX1. J Clin Oncol. 2010;28(24):3858–3865. - PubMed
    1. Klinakis A, Lobry C, Abdel-Wahab O, et al. A novel tumour-suppressor function for the Notch pathway in myeloid leukaemia. Nature. 2011;473(7346):230–233. - PMC - PubMed

Publication types

MeSH terms

Substances