Randomized Controlled Trial
. 2013 Aug;260(8):2023-32.
doi: 10.1007/s00415-013-6932-0. Epub 2013 Apr 30.

Fingolimod versus intramuscular interferon in patient subgroups from TRANSFORMS

Affiliations
Randomized Controlled Trial

Fingolimod versus intramuscular interferon in patient subgroups from TRANSFORMS

Jeffrey A Cohen et al. J Neurol. 2013 Aug.

Abstract

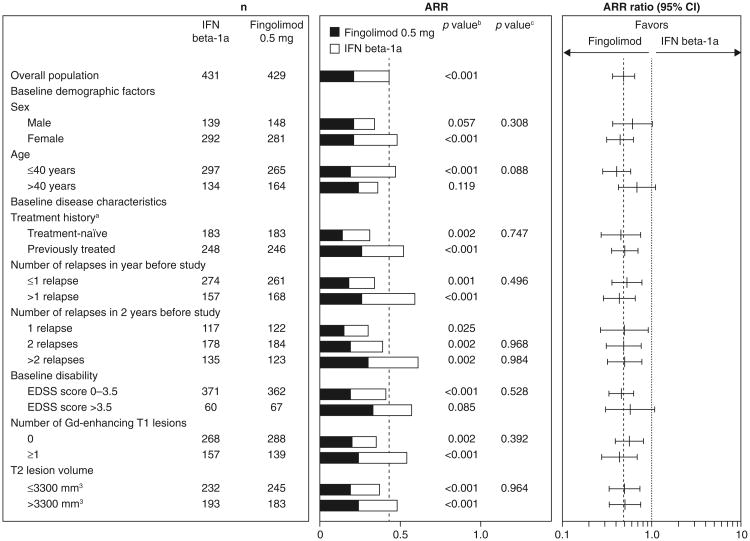
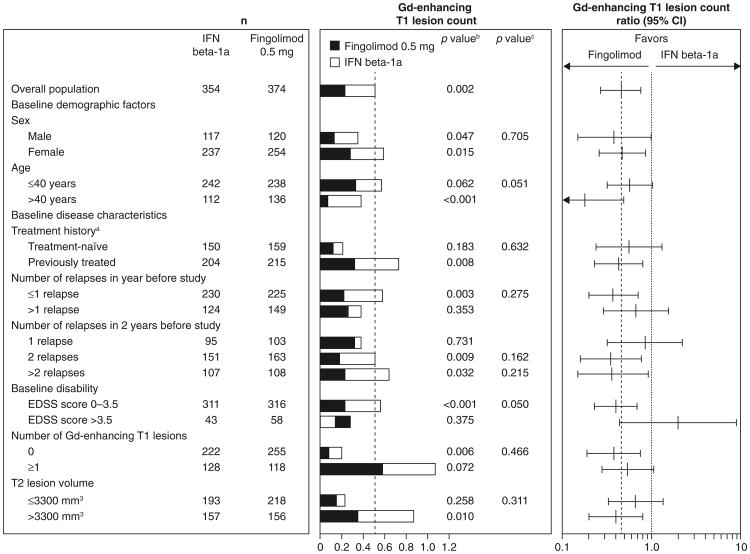
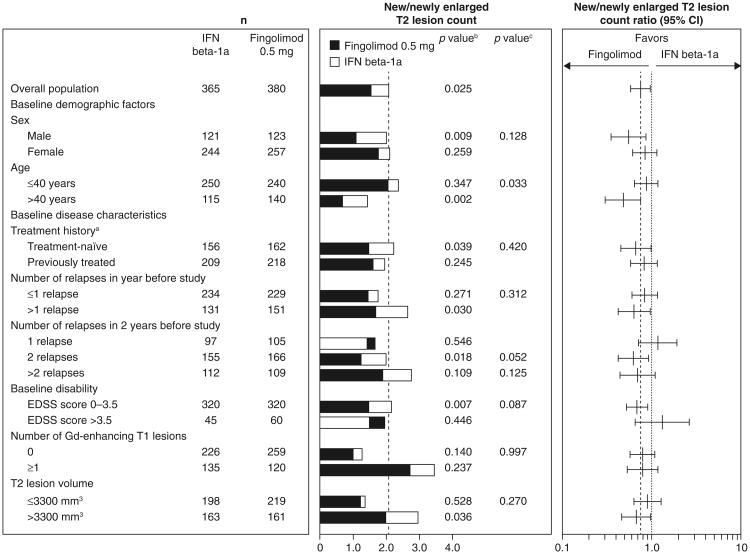
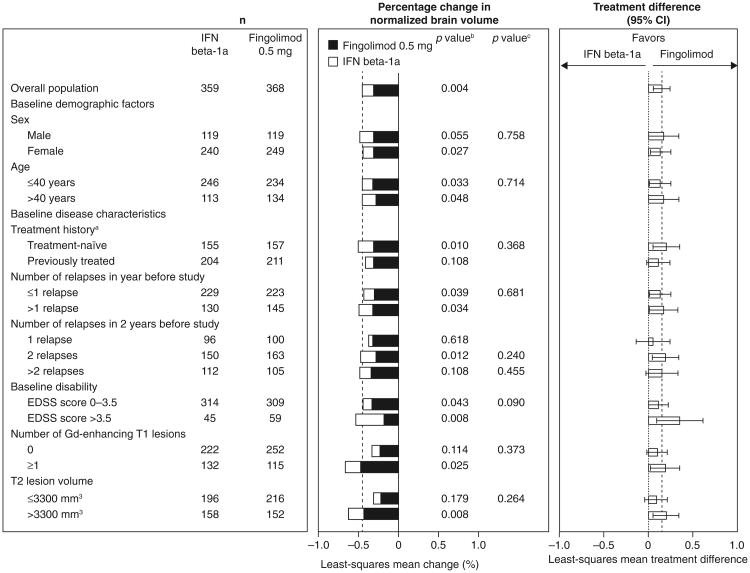
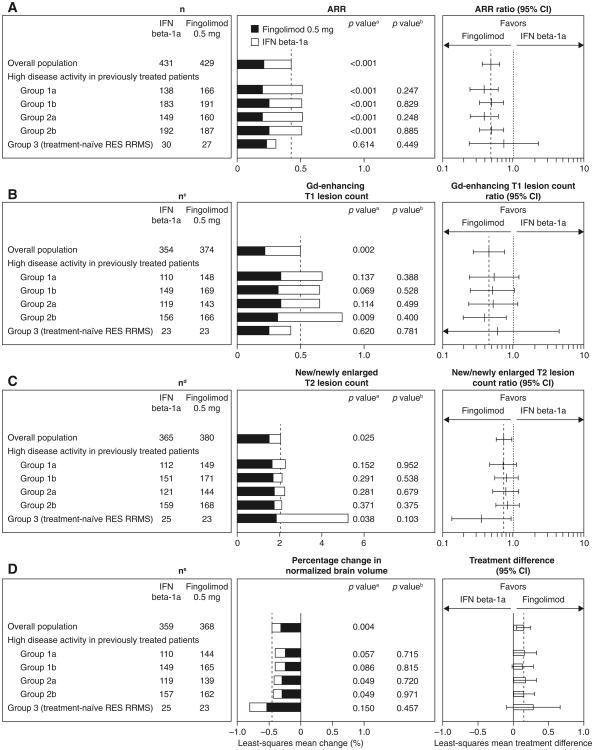
In the 12-month phase 3 TRANSFORMS study, fingolimod showed greater efficacy than intramuscular interferon beta (IFNβ)-1a in patients with relapsing-remitting multiple sclerosis (RRMS). This study analyzed fingolimod efficacy compared with IFNβ-1a in patient subgroups from TRANSFORMS. Patients were randomized to receive fingolimod or weekly IM IFNβ-1a for 12 months. Analyses of efficacy included annualized relapse rate (ARR), and magnetic resonance imaging (MRI) measures [gadolinium (Gd)-enhancing T1 lesions, new/newly enlarged (active) T2 lesions, brain volume change]. Subgroups were defined based on demographics, disease characteristics (baseline EDSS score, relapse rate, and MRI parameters), and response to previous therapy. Fingolimod 0.5 mg reduced ARR over 12 months by 32-59 % relative to IFNβ-1a in all subgroups defined by demographic factors or baseline disease characteristics. Fingolimod also reduced the number of new Gd-enhancing lesions, active T2 lesions, and the rate of brain volume loss, versus IFNβ-1a in most (95 %) subgroups. In patients with high disease activity despite IFNβ treatment in the year before study, fingolimod 0.5 mg reduced ARR by 61 % relative to IFNβ-1a. Reductions in lesion counts and brain volume loss also favored fingolimod in these patients. In conclusion, consistently better efficacy was observed for fingolimod compared with IFNβ-1a across different subgroups of patients with RRMS.


Conflict of interest statement

Conflicts of interest Prof. Cohen has received reimbursement for travel or consulting from Biogen Idec, Elan, Novartis, Teva, and Vaccinex. He has also received research support paid to his institution from Biogen Idec, Novartis, Receptos, Teva, Synthon, and Vaccinex. Dr. Barkhof has received consultancy fees from Bayer Schering Pharma, Sanofi-Aventis, Biogen Idec, GE Medical Systems, Genzyme, Synthon, Novartis and Roche. He has served as an editorial board member for Brain, Journal of Neurology, European Radiology and Neuroradiology. He has received payment for speaker services from Novartis and Serono. Barkhof has also received research support from the Dutch Foundation for MS Research. Prof. Comi has received consulting fees for speaker services from Novartis, Teva Pharmaceutical Industries, Sanofi-Aventis, Merck Serono, Bayer and Actelion. He has also received lecture fees from Novartis, Teva Pharmaceutical Industries, Sanofi-Aventis, Merck Serono, Biogen Dompè, Bayer and Serono Symposia International Foundation. Prof. Izquierdo has received payment for board membership of Biogen, Novartis, Sanofi, Serono and Teva. He has also received consultancy fees or honorarium from Biogen Idec, Merck, Bayern, Sanofi, Teva and Novartis. Dr. Khatri has received consultancy fees from Teva, Biogen Idec, Bayer, Pfizer, Genzyme, Questcor, Avanit, Novartis and Teurimo BCT. He has received research support from Biogen Idec and Novartis. Dr. Montalban has received speaking honoraria and travel expenses for scientific meetings, has been a steering committee member of clinical trials or participated in advisory boards of clinical trials in the past years with Bayer Schering Pharma, Biogen Idec, EMD Merck Serono, Genentech, Genzyme, Novartis, Sanofi-Aventis, Teva Pharmaceutical Industries and Almirall. Prof. Pelletier has received payment for scientific advisory boards for Allergan, Bayer Schering Pharma, Biogen Idec, Genzyme, Merck Serono, Novartis, Sanofi and Teva. He has received non-profit foundation support from ARSEP, academic research support from PHRC, and unconditional research support from Bayer Schering Pharma, Biogen Idec, Merck Serono, Novartis, Sanofi and Teva. Dr. Eckert is an employee of Novartis Pharmaceuticals Corporation, East Hanover, NJ, USA. Dr. Häring is an employee of Novartis Pharma AG, Basel, Switzerland. Dr. Francis is an employee of Novartis Pharmaceuticals Corporation, East Hanover, NJ, USA.

Figures

Fig. 1
Fig. 1
ARRs over 12 months in patient subgroups defined by demographic factors and baseline disease characteristics (intent-to-treat population). The ARRs and ARR ratios estimated using a negative binomial regression model adjusted for treatment, and (for subgroup analyses only) subgroup variable and treatment by subgroup variable interaction; log time on study was used as an offset variable. aPatients were categorized according to whether they were treatment-naïve (had received no form of medication for MS before the study) or had previously received treatment for MS with any medication at any time before study enrollment. bp value for the treatment contrast within the subgroup. cp value for the treatment by subgroup interaction, which evaluates heterogeneity of the treatment effect (see “Methods”). ARR annualized relapse rate, EDSS expanded disability status scale, Gd gadolinium, IFN interferon, MS multiple sclerosis
Fig. 2
Fig. 2
Gd-enhancing T1 lesion counts and ratios over 12 months in patient subgroups defined by demographic factors and baseline disease characteristics (intent-to-treat population). Gd-enhancing T1 lesion counts were estimated using a negative binomial regression model, log-link, adjusted for treatment for the overall result, and adjusted for treatment subgroup and treatment by subgroup variable interaction for the subgroup analyses. n number of observations included in the analysis (patients with non-missing Gd-enhancing T1 lesion count assessments at month 12; scans obtained <30 days after the last use of steroids to treat MS were excluded from this analysis). aPatients were categorized according to whether they were treatment-naïve (had received no form of medication for MS before the study) or had previously received treatment for MS with any medication at any time before study enrollment. bp value for the treatment contrast within the subgroup. cp value for the treatment by subgroup interaction, which evaluates heterogeneity of the treatment effect (see “Methods”). EDSS expanded disability status scale, Gd gadolinium, IF interferon, MS multiple sclerosis
Fig. 3
Fig. 3
New/newly enlarging T2 lesion counts and ratios over 12 months in patient subgroups defined by demographic factors and baseline disease characteristics (intent-to-treat population). New/newly enlarged T2 lesion counts were estimated using a negative binomial regression model, log-link, adjusted for treatment for the overall result, and adjusted for treatment subgroup and treatment by subgroup variable interaction for the subgroup analyses. n number of observations included in the analysis (patients with non-missing new/newly enlarged T2 lesion count assessments at month 12). aPatients were categorized according to whether they were treatment-naïve (had received no form of medication for MS before the study) or had previously received treatment for MS with any medication at any time before study enrollment. bp value for the treatment contrast within the subgroup. cp value for the treatment by subgroup interaction, which evaluates heterogeneity of the treatment effect (see “Methods”). EDSS expanded disability status scale, Gd gadolinium, IFN interferon, MS multiple sclerosis
Fig. 4
Fig. 4
Percentage change in normalized brain volume over 12 months in patient subgroups defined by demographic factors and baseline disease characteristics (intent-to-treat population). The percentage change in brain volume was analyzed using an ANOVA model adjusted for treatment for the overall result and for treatment, subgroup, and treatment by subgroup interaction for subgroup analyses. The p value for the ANOVA analysis refers to a t test for the treatment contrast. n number of patients in each group with a non-missing assessment of percentage change from baseline in normalized brain volume at month 12. aPatients were categorized according to whether they were treatment-naïve (had received no form of medication for MS before the study) or had previously received treatment for MS with any medication at any time before study enrollment. bp value for the treatment contrast within the subgroup. cp value for the treatment by subgroup interaction, which evaluates heterogeneity of the treatment effect (see “Methods”). ANOVA analysis of variance, EDSS expanded disability status scale, Gd gadolinium, IFN interferon, MS multiple sclerosis
Fig. 5
Fig. 5
a Annualized relapse rates, b Gd-enhancing T1 lesion count, c estimated new/newly enlarged T2 lesion count and d brain volume loss for fingolimod versus interferon beta-1a over 12 months in previously treated or treatment-naïve patients with highly active disease (intent-to-treat population). For definition of the patient groups, see “Methods”. ARRs and ARR ratios were estimated using a negative binomial regression model adjusted for treatment, and (for subgroup analyses only) subgroup variable and treatment by subgroup variable interaction; log time on study was used as an offset variable. Gd-enhancing T1 and new/newly enlarged T2 lesion counts were estimated using a negative binomial regression model, log-link, adjusted for treatment for the overall result, and adjusted for treatment subgroup and treatment by subgroup variable interaction for the subgroup analyses. Least-squares mean change in brain volume calculated using an ANOVA model adjusted for treatment for the overall result and for treatment, subgroup, and treatment by subgroup interaction for subgroup analyses. ap value for the treatment contrast within the subgroup. bp value for the treatment by subgroup interaction, which evaluates heterogeneity of the treatment effect (see “Methods”). cn number of observations included in this analysis (patients with non-missing Gd-enhancing T1 lesion count assessments at month 12; scans obtained <30 days after the last use of steroids to treat MS were excluded from this analysis). dn number of observations included in this analysis (patients with non-missing new/newly enlarged T2 lesion count assessments at month 12). en number of patients in each group with a non-missing assessment of percentage change from baseline in normalized brain volume at month 12. ANOVA analysis of variance, ARR annualized relapse rate, DMT disease-modifying therapy, Gd gadolinium, IFN interferon, RES rapidly evolving severe, RRMS relapsing–remitting multiple sclerosis

References

    1. Cohen JA, Barkhof F, Comi G, Hartung HP, Khatri BO, Montalban X, Pelletier J, Capra R, Gallo P, Izquierdo G, Tiel-Wilck K, de Vera A, Jin J, Stites T, Wu S, Aradhye S, Kappos L. Oral fingolimod or intramuscular interferon for relapsing multiple sclerosis. N Engl J Med. 2010;362:402–415. - PubMed
    1. Kappos L, Radue EW, O'Connor P, Polman C, Hohlfeld R, Calabresi P, Selmaj K, Agoropoulou C, Leyk M, Zhang-Auberson L, Burtin P. A placebo-controlled trial of oral fingolimod in relapsing multiple sclerosis. N Engl J Med. 2010;362(5):387–401. - PubMed
    1. Khatri B, Barkhof F, Comi G, Hartung HP, Kappos L, Montalban X, Pelletier J, Stites T, Wu S, Holdbrook F, Zhang-Auberson L, Francis G, Cohen JA. Comparison of fingolimod with interferon beta-1a in relapsing-remitting multiple sclerosis: a randomised extension of the TRANSFORMS study. Lancet Neurol. 2011;10(6):520–529. - PubMed
    1. Brex PA, Ciccarelli O, O'Riordan JI, Sailer M, Thompson AJ, Miller DH. A longitudinal study of abnormalities on MRI and disability from multiple sclerosis. N Engl J Med. 2002;346(3):158–164. - PubMed
    1. Confavreux C, Vukusic S. Age at disability milestones in multiple sclerosis. Brain. 2006;129(Pt 3):595–605. - PubMed

Publication types

MeSH terms

LinkOut - more resources