Comparative Study
. 2014 Apr;35(4):1544-61.
doi: 10.1002/hbm.22272. Epub 2013 Apr 30.

Assessment of tonotopically organised subdivisions in human auditory cortex using volumetric and surface-based cortical alignments

Affiliations
Comparative Study

Assessment of tonotopically organised subdivisions in human auditory cortex using volumetric and surface-based cortical alignments

Dave R M Langers. Hum Brain Mapp. 2014 Apr.

Abstract

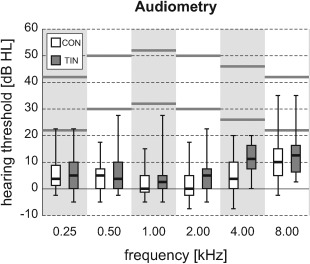
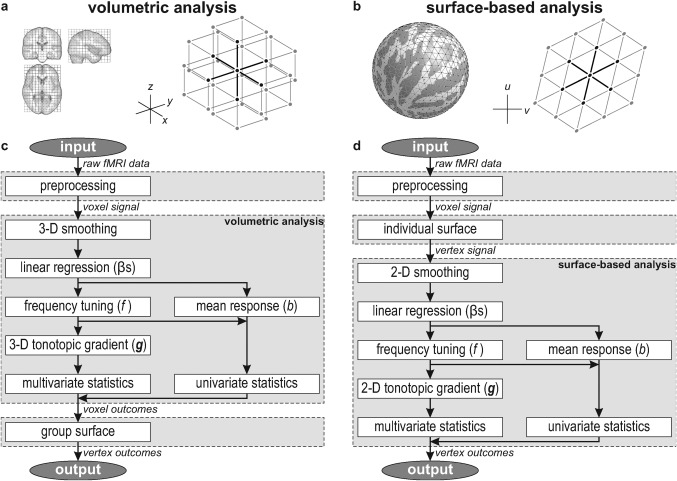
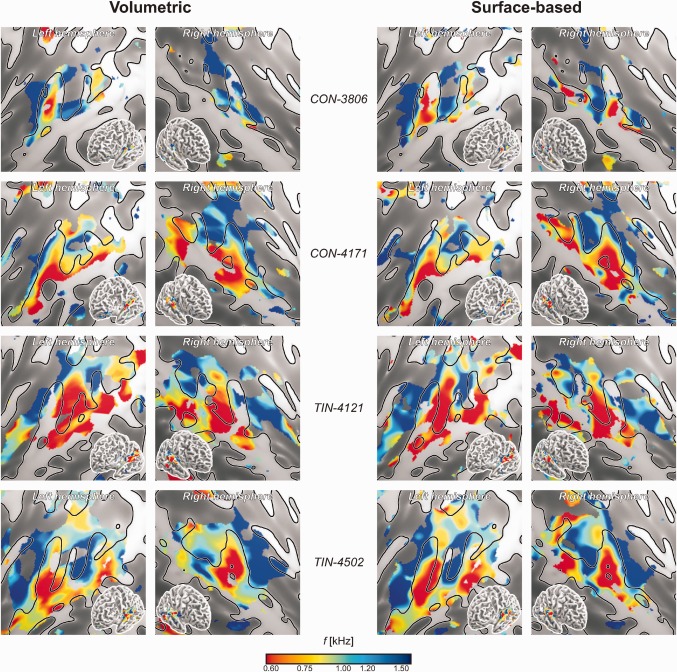
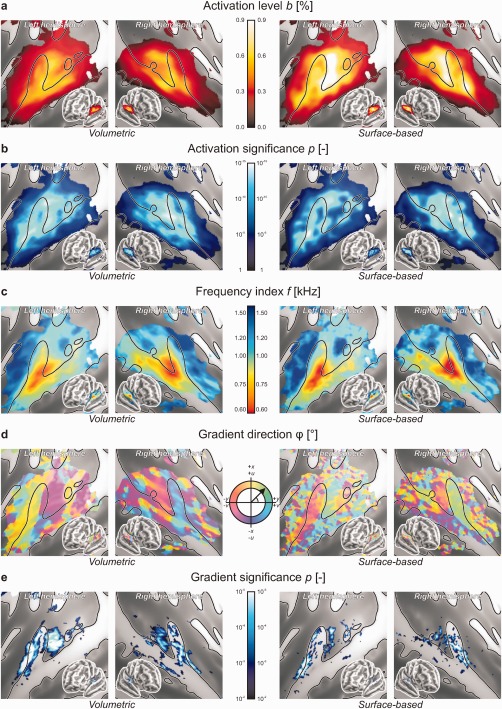
Although orderly representations of sound frequency in the brain play a guiding role in the investigation of auditory processing, a rigorous statistical evaluation of cortical tonotopic maps has so far hardly been attempted. In this report, the group-level significance of local tonotopic gradients was assessed using mass-multivariate statistics. The existence of multiple fields on the superior surface of the temporal lobe in both hemispheres was shown. These fields were distinguishable on the basis of tonotopic gradient direction and may likely be identified with the human homologues of the core areas AI and R in primates. Moreover, an objective comparison was made between the usage of volumetric and surface-based registration methods. Although the surface-based method resulted in a better registration across subjects of the grey matter segment as a whole, the alignment of functional subdivisions within the cortical sheet did not appear to improve over volumetric methods. This suggests that the variable relationship between the structural and the functional characteristics of auditory cortex is a limiting factor that cannot be overcome by morphology-based registration techniques alone. Finally, to illustrate how the proposed approach may be used in clinical practice, the method was used to test for focal differences regarding the tonotopic arrangements in healthy controls and tinnitus patients. No significant differences were observed, suggesting that tinnitus does not necessarily require tonotopic reorganisation to occur.

Keywords: auditory cortex; cochleotopy; functional magnetic resonance imaging (fMRI); plasticity; registration; tinnitus; tonotopy; topographic maps.


Figures

Figure 1
Figure 1
Hearing thresholds were measured at all octave frequencies from 0.25 to 8.00 kHz. Results were averaged over both ears and shown by means of box plots (showing inter‐quartile ranges for both subject groups). Stimuli were presented at two intensity levels that differed by 20 dB, approximately indicated by the horizontal grey lines.
Figure 2
Figure 2
(a) The anatomical image volumes of subjects were registered by normalising them to a standard stereotaxic space. In the resulting cubic grid, each voxel typically has six face‐neighbours that are taken into account to determine three‐dimensional gradients regarding stimulus preference. (b) In parallel, cortical surfaces were determined for all subjects and registered on the basis of their gyration patterns. In the resulting triangular mesh, each voxel typically has six edge‐neighbours that are taken into account to determine two‐dimensional gradients regarding stimulus preference. (c,d) Flow charts summarising the volumetric and surface‐based analyses, respectively. In the volumetric approach, analyses are carried out voxel‐by‐voxel, and the results are projected on a group cortical surface for visualisation purposes only; in the surface‐based approach, data are sampled on individual cortical surfaces in an early stage, and analyses are carried out vertex‐by‐vertex.
Figure 3
Figure 3
Individual tonotopic maps depicting the spatial distribution of frequency indices f (converted to kHz) in four individual subjects according to the volumetric (left) and surface‐based (right) analyses. The top two subjects belonged to the control group (CON); the bottom two are tinnitus patients (TIN). Supporting Information Figures 1 and 2 show similar maps for all 40 subjects according to the volumetric and surface‐based analyses, respectively. Results from all vertices that showed significant sound‐evoked responses (P < 0.05, uncorrected) are colour‐mapped on flattened cortical representations, showing the individual gyral morphology (light, gyri; dark, sulci). Insets show a complete semi‐inflated hemisphere. Despite of some inter‐individual variations, low frequencies tend to be represented in lateral HG and superior temporal cortex, whereas high frequencies tend to occur more medially rostrally and caudally to HG. Note that although individual cortical features are shown in all panels to facilitate comparisons, the volumetric results were actually obtained using a fixed group‐average surface.
Figure 4
Figure 4
Group‐level outcomes based on volumetric (left) and surface‐based (right) registration. The results of a supplementary surface‐based analysis with 8‐mm smoothing are shown in Supporting Information Figure 3. (a) The mean activation level b was determined by averaging the responses to all six stimulus frequencies, expressed as a percentage signal change relative to the silent baseline. The strongest responses were found on the caudal side of HG. (b) The group‐level significance of sound‐evoked responses was assessed using conventional mass‐univariate statistics. (c) Frequency tuning as expressed by the frequency index f (converted to kHz) gradually varied across the sound‐activated regions of auditory cortex. Low frequencies were represented laterally on HG and STG, whereas high frequencies were represented medially on the rostral and caudal banks of HG and PT. (d) Tonotopic gradients were determined in appropriate coordinate systems in the axial plane (x, y) for the volumetric analysis or in a plane locally tangent to the sphere (u, v) for the surface‐based analysis, and their direction was displayed by means of a colour‐code. Homogeneous strips of cortex were found to exist, separated by relatively sharp transitions in gradient direction. (e) The group‐level significance of the local tonotopic gradient was tested against the null‐vector using mass‐multivariate statistics. Multiple coherent tonotopic patches could be distinguished.
Figure 5
Figure 5
The outcomes of the volumetric and surface‐based analyses (Figure 4) were directly compared. Each point corresponds with the data from a single vertex on the cortical surface. The panels show: (a) mean activation levels (Fig. 4a); (b) the significance of sound‐evoked activation (Fig. 4b); (c) frequency indices (Fig. 4c); and, (d) the significance of local tonotopic gradients (Fig. 4e).
Figure 6
Figure 6
The results from the normal hearing controls (CON) and tinnitus patients (TIN) were compared and statistically assessed at the group level. Panels show the significance of group differences regarding (a) mean activation levels b, (b) frequency indices f and (c) gradient vectors g. Except for isolated focal effects that were insignificant after correction for family‐wise errors, no differences were observed. (A supplementary surface‐based analysis with 8‐mm smoothing (data not shown) similarly did not reveal any significant effects.) [Color figure can be viewed in the online issue, which is available at http://wileyonlinelibrary.com.]
Figure 7
Figure 7
A three‐dimensional rendering of key results on the group‐average semi‐inflated temporal lobe surface. Results were copied from the surface‐based analysis with 5‐mm smoothing, employing colour‐codes identical to those shown in Figure 4a,c,d. Notable morphological features include the planum polare (PP), circular sulcus (CiS), Heschl's gyrus (HG), Heschl's sulcus (HS), planum temporale (PT), temporoparietal junction (TPJ), superior temporal gyrus (STG), and superior temporal sulcus (STS). The superimposed dashed lines delineate the approximate outline of two fields on rostral (rHG) and caudal (cHG) HG that could be clearly distinguished on the basis of the tonotopic organisation. Evidence for at least one additional field labelled PT was additionally found further posteriorly. On the lateral side, adjacent to STS, the organisation was ambiguous (DISCUSSION section).

Similar articles

Cited by

References

    1. Bartels H, Staal MJ, Albers FWJ (2007): Tinnitus and neural plasticity of the brain. Otol Neurotol 28:178–184. - PubMed
    1. Barton B, Venezia JH, Saberi K, Hickok G, Brewer AA (2012): Orthogonal acoustic dimensions define auditory field maps in human cortex. Proc Natl Acad Sci USA 109:20738–20743. - PMC - PubMed
    1. Baumgart F, Kaulisch T, Tempelmann C, Gaschler‐Markefski B, Tegeler C, Schindler F, Stiller D, Scheich H (1998): Electrodynamic headphones and woofers for application in magnetic resonance imaging scanners. Med Phys 25:2068–2070. - PubMed
    1. Bendor D, Wang X (2005): The neuronal representation of pitch in primate auditory cortex. Nature 436:1161–1165. - PMC - PubMed
    1. Benjamini Y, Hochberg Y (1995): Controlling the false discovery rate: A practical and powerful approach to multiple testing. J Roy Stat Soc B Met 57:289–300.

Publication types