. 2014 Apr;35(4):1710-22.
doi: 10.1002/hbm.22286. Epub 2013 Apr 30.

Intrahemispheric and interhemispheric structural network abnormalities in PLS and ALS

Affiliations

Intrahemispheric and interhemispheric structural network abnormalities in PLS and ALS

Federica Agosta et al. Hum Brain Mapp. 2014 Apr.

Abstract

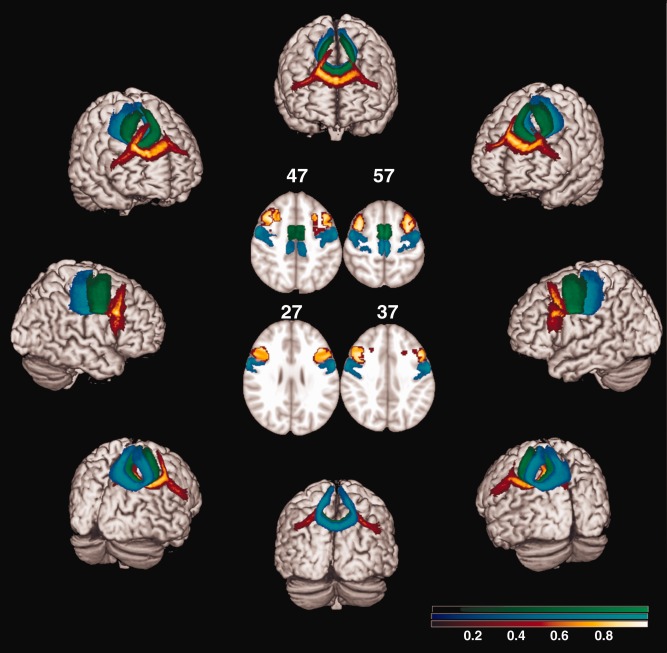
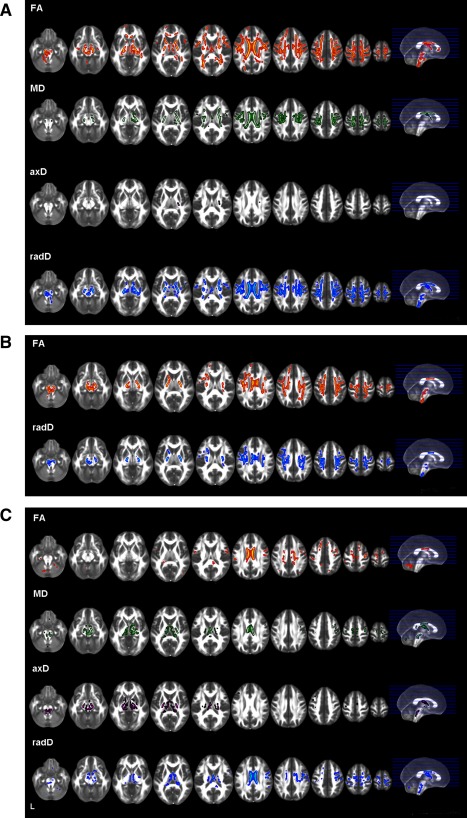
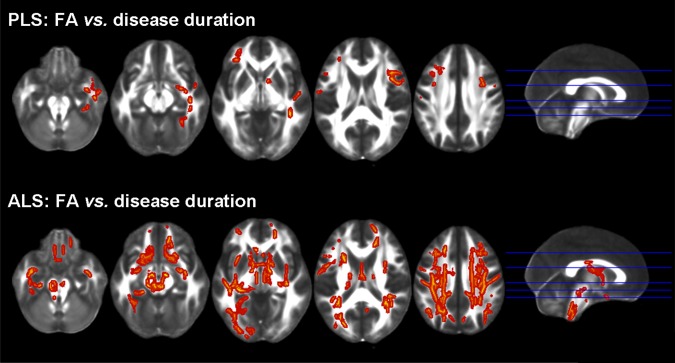
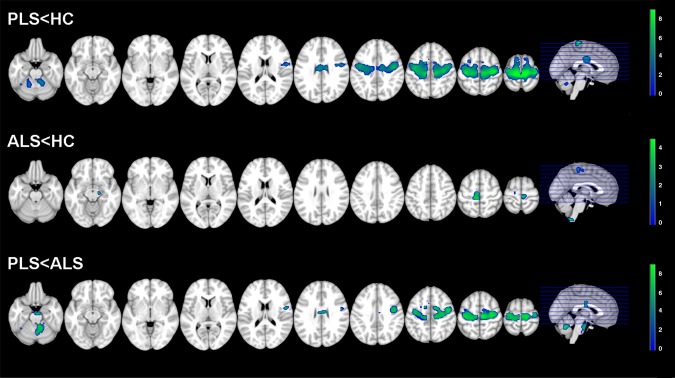
Using diffusion tensor (DT) magnetic resonance imaging (MRI), damage to brain intrahemispheric and interhemispheric connections was assessed in 26 sporadic primary lateral sclerosis (PLS) patients compared with 28 sporadic amyotrophic lateral sclerosis (ALS) patients with similar disability and 35 healthy controls. DT MRI diagnostic accuracy in distinguishing the two motor neuron disease (MND) variants was tested. PLS and ALS patients showed a distributed pattern of abnormalities of the motor system, including the corticospinal tracts and corpus callosum (CC). PLS versus ALS patients showed a more severe damage to the motor CC fibers and subcortical white matter (WM) underlying the primary motor cortices. Both patient groups showed an extra-motor damage, which was more severe in PLS. This did not appear to be driven by longer disease duration in PLS. In PLS patients, damage to the CC mid-body correlated with the severity of upper motor neuron clinical burden. CC fractional anisotropy values had the highest accuracy in distinguishing PLS from controls and ALS. PLS and ALS share an overlapped pattern of WM abnormalities. This underscores that PLS, despite its distinct clinical phenotype and long survival, still lies within the wider MND spectrum. Whether CC diffusivity may be a novel marker to increase confidence in an early diagnostic separation of PLS from ALS still needs to be investigated.

Keywords: DT MRI; VBM; amyotrophic lateral sclerosis; brain atrophy; primary lateral sclerosis; white matter damage.


Figures

Figure 1
Figure 1
Probabilistic maps of the three partitions of corpus callosum (CC) from all subjects included in the study with an example of the target ROI in standard space (centre of the figure). The target ROIs are shown with the same colors of the corresponding tract, at the MNI coordinates of z = 57, 47, 37 and 27. The tracts are overlaid on a 3D rendering of the MNI standard brain. Only voxels present in at least 10% of the subjects are shown. The color scale indicates the degree of overlap among subjects. CC‐primary motor cortex is shown in blue‐light blue, CC‐SMA in green, CC‐premotor cortex in red‐yellow.
Figure 2
Figure 2
Tract based spatial statistics: areas of significant decreased FA and increased mean (MD), axial (axD) and radial (radD) diffusivity in primary lateral sclerosis (PLS) patients compared with healthy controls (A), amyotrophic lateral sclerosis (ALS) patients compared with healthy controls (B), and PLS patients compared with those with ALS (C). The results are overlaid on the axial sections of a FA template in the MNI standard space in neurological convention (left is left), and displayed at P < 0.05, Family Wise Error (FWE)‐corrected, for the comparisons between patients and controls, and P < 0.05, uncorrected, for the direct comparison between patient groups.
Figure 3
Figure 3
Tract based spatial statistics: FA versus disease duration and upper motor neuron (UMN) clinical score. Regions of significant correlations between FA and disease duration or UMN score in patients with primary lateral sclerosis (PLS) and amyotrophic lateral sclerosis (ALS) are overlaid on the axial sections of a FA template in the MNI standard space. Results are shown in neurological convention (left is left), at P < 0.05, Family Wise Error (FWE)‐corrected.
Figure 4
Figure 4
Voxel based morphometry (VBM): areas of brain tissue loss in primary lateral sclerosis (PLS) and amyotrophic lateral sclerosis (ALS) patients compared with healthy controls and each other. Results are overlaid on the axial sections of a T1‐weighted template in the MNI standard space in neurological convention (left is left). VBM results are displayed at P < 0.001, uncorrected. The color scale indicates T‐values.

Similar articles

Cited by

References

    1. Agosta F, Chio A, Cosottini M, De Stefano N, Falini A, Mascalchi M, Rocca MA, Silani V, Tedeschi G, Filippi M (2010): The present and the future of neuroimaging in amyotrophic lateral sclerosis. AJNR Am J Neuroradiol 31:1769–1777. - PMC - PubMed
    1. Agosta F, Scola E, Canu E, Marcone A, Magnani G, Sarro L, Copetti M, Caso F, Cerami C, Comi G, Cappa SF, Falini A, Filippi M (2012): White matter damage in frontotemporal lobar degeneration spectrum. Cerebral Cortex 22:2705–2714. - PubMed
    1. Beal MF, Richardson EP, Jr. (1981): Primary lateral sclerosis: A case report. Arch Neurol 38:630–633. - PubMed
    1. Behrens TE, Berg HJ, Jbabdi S, Rushworth MF, Woolrich MW (2007): Probabilistic diffusion tractography with multiple fibre orientations: What can we gain? Neuroimage 34:144–155. - PMC - PubMed
    1. Brooks BR, Miller RG, Swash M, Munsat TL (2000): El Escorial revisited: Revised criteria for the diagnosis of amyotrophic lateral sclerosis. Amyotroph Lateral Scler Other Motor Neuron Disord 1:293–299. - PubMed

Publication types