. 2013 May 1;54(5):3721-8.
doi: 10.1167/iovs.13-11812.

Human photoreceptor outer segments shorten during light adaptation

Affiliations

Human photoreceptor outer segments shorten during light adaptation

Michael D Abràmoff et al. Invest Ophthalmol Vis Sci. .

Abstract

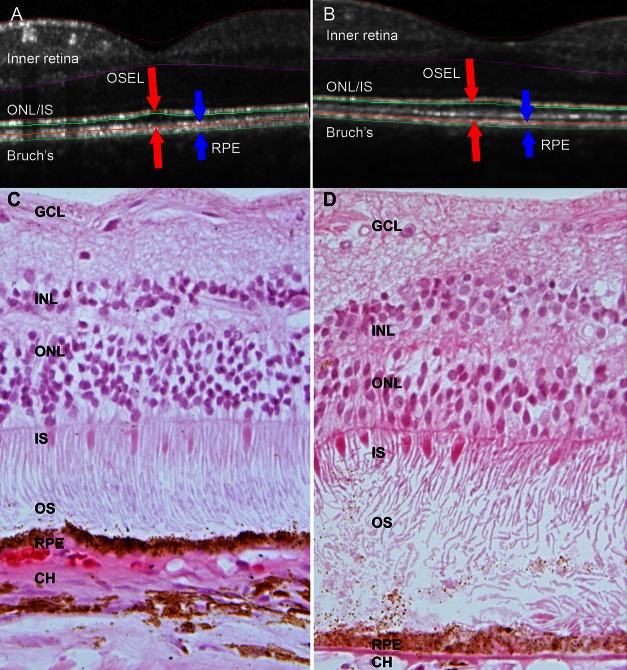
Purpose: Best disease is a macular dystrophy caused by mutations in the BEST1 gene. Affected individuals exhibit a reduced electro-oculographic (EOG) response to changes in light exposure and have significantly longer outer segments (OS) than age-matched controls. The purpose of this study was to investigate the anatomical changes in the outer retina during dark and light adaptation in unaffected and Best disease subjects, and to compare these changes to the EOG.

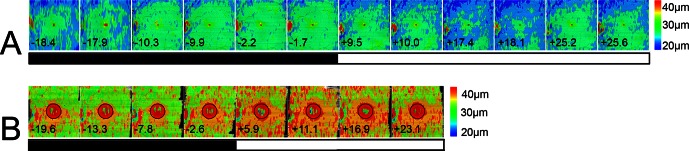
Methods: Unaffected (n = 11) and Best disease patients (n = 7) were imaged at approximately 4-minute intervals during an approximately 40-minute dark-light cycle using spectral domain optical coherence tomography (SD-OCT). EOGs of two subjects were obtained under the same conditions. Automated three-dimensional (3-D) segmentation allowed measurement of light-related changes in the distances between five retinal surfaces.

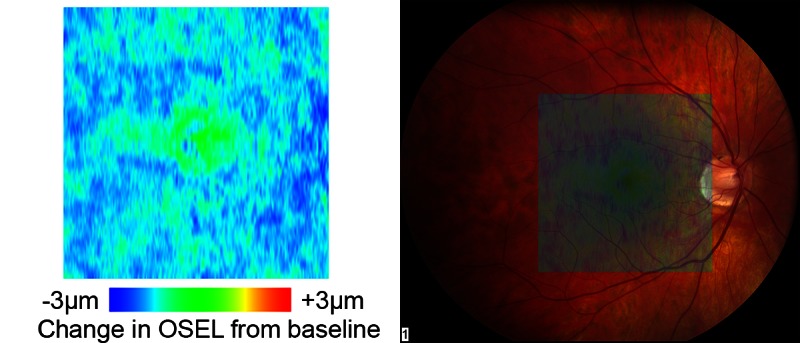
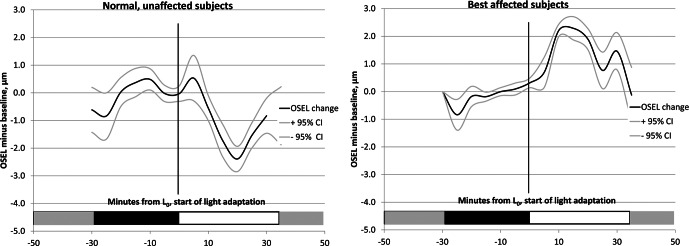
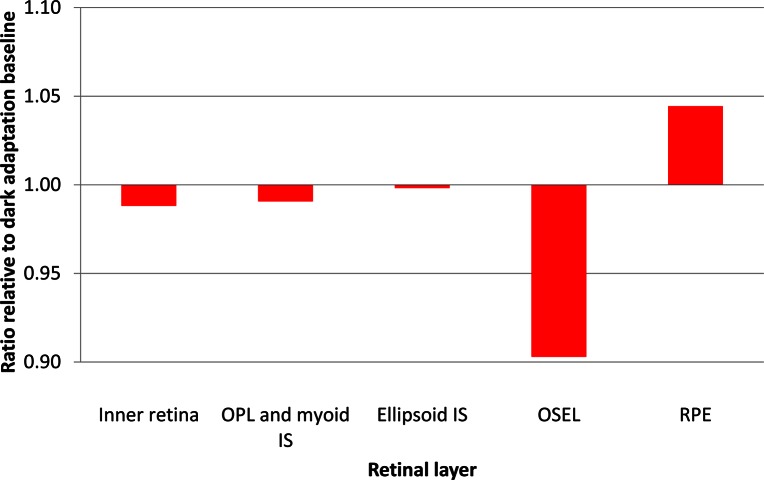
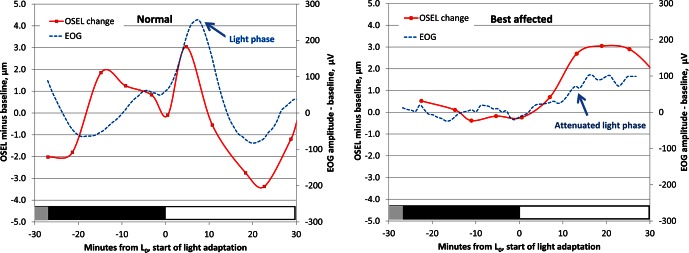
Results: In normal subjects, there was a significant decrease in outer segment equivalent length (OSEL) of -2.14 μm (95% confidence interval [CI], -1.77 to -2.51 μm) 10 to 20 minutes after the start of light adaptation, while Best disease subjects exhibited a significant increase in OSEL of 2.07 μm (95% CI, 1.79-2.36 μm). The time course of the change in OS length corresponded to that of the EOG waveform.

Conclusions: Our results strongly suggest that the light peak phase of the EOG is temporally related to a decreased OSEL in normal subjects, and the lack of a light peak phase in Best disease subjects is associated with an increase in OSEL. One potential role of Bestrophin-1 is to trigger an increase in the standing potential that approximates the OS to the apical surface of the RPE to facilitate phagocytosis.

Keywords: Best disease; OCT; eletro-oculogram; photoreceptor cells.


Figures

Figure 1.
Figure 1.
Elongation of photoreceptor cell outer segments in Best disease, depicted by OCT (A, B) and histology (C, D). (A, C) Unaffected subjects; (B, D) subjects with Best disease. (A) SD-OCT central B-scan from single normal subject. The distance between the red arrows is defined as the OSEL, and the distance between the blue arrows corresponds to the RPE. Although only two dimensions are depicted, the analysis of OSEL and other retinal structures is performed in three dimensions; thus small discrepancies between true surface and segmentation exist in individual B-scans. Note the areas of extremely long and/or unphagocytosed photoreceptor outer segments in (D), outside of the area of central scarring and over an intact RPE layer. GCL, ganglion cell layer; INL, inner nuclear layer; ONL, outer nuclear layer; IS, inner segments; OS, outer segments; RPE, retinal pigment epithelium.
Figure 2.
Figure 2.
OSEL maps of the macula of unaffected and Best disease patient eyes; analyzed SD-OCT scans are 6.3 × 6.3 mm. (A) Left eye OSEL maps of the macula of a single unaffected subject (subject 3) during the dark–light adaptation protocol. The numbers at the bottom of each map indicate time to start of light adaptation in minutes. Because of varying scanner data storage times, scans could not be taken at regular intervals. The black and white bar indicates dark and light adaptation portions of the experiment. The color bar at right shows the thicknesses in micrometers that correspond to the colors used in the map. The OSEL increases during dark adaptation and then begins decreasing as soon as light adaptation starts, with a minimum OSEL occurring between 17 and 25.2 minutes after light onset in this subject. The thick area at the left edge of the image is part of the optic nerve head and does not contribute to the light–dark thickness variability. (B) Left eye OSEL maps of a subject with Best disease (subject B5) during dark−light adaptation protocol. In Best patients, OSEL is greater than normal even during dark adaptation, and the OSEL increases further as soon as light adaptation starts. The maximum OSEL occurred between 16.9 and 23.1 minutes after light onset in this subject. For each individual affected with Best disease, the area of the vitelliform lesion was excluded from quantitative analysis. The exclusion zone in this patient is indicated by a black circle.
Figure 3.
Figure 3.
Left: change map of OSEL in micrometers for a normal subject (subject 2) showing decrease of the OSEL over the entire macula during light adaptation. Right: superposition of the OSEL change map over a color fundus image of the same eye showing the retinal location of the changes.
Figure 4.
Figure 4.
Average OSEL change from baseline and 95% confidence intervals for all subjects during dark and light adaptation. Left: normal subjects (n = 11). Right: subjects affected with Best disease (n = 6). In normal subjects, OSEL initially increases for the first few minutes after light onset and then rapidly decreases, with the minimum OSEL occurring approximately 20 minutes after the start of light adaptation. In subjects affected with Best disease, the OSEL increases after start of light adaptation, and the maximum OSEL occurs between 10 and 15 minutes after light onset.
Figure 5.
Figure 5.
Graph depicting site of photoreceptor cell shortening. The relative change in thickness of different retinal layers in normal subject 4 in the 10-minute interval from 12.5 to 22.5 minutes after the start of light adaptation, the period when OSEL is maximally decreased. Ratios are calculated with reference to average thickness of the corresponding layers during dark adaptation. Outer segments show a reduction of approximately 10% during light adaptation, while other layers are essentially unchanged. OPL, outer plexiform layer; IS, inner segments; RPE, retinal pigment epithelium.
Figure 6.
Figure 6.
Relationship between EOG and the change in photoreceptor OSEL in a single experiment in a normal subject (subject 4, left) and a Best disease–affected subject (subject B2, right). In normals, during light adaption there is brief apparent lengthening of the outer segments, then a larger and more prolonged shortening that is temporally correlated to the fall in EOG voltage that follows the light phase. In Best disease subjects, during light adaptation the EOG is almost flat, and only the lengthening of the OSEL is seen. Vertical axes, left: difference in OSEL in micrometers from average thickness during dark adaptation; right: smoothed EOG amplitude change from baseline (μV). Horizontal axes: time from start of light adaptation (L0) in minutes.

References

    1. Best F. II. Über eine hereditäre Maculaaffektion. Ophthalmologica. 1905; 13: 199–212
    1. Stone EM, Nichols BE, Streb LM, Kimura AE, Sheffield VC. Genetic linkage of vitelliform macular degeneration (Best's disease) to chromosome 11q13. Nat Genet. 1992; 1: 246–250 - PubMed
    1. Petrukhin K, Koisti MJ, Bakall B, et al. Identification of the gene responsible for Best macular dystrophy. Nat Genet. 1998; 19: 241–247 - PubMed
    1. Iannaccone A, Kerr NC, Kinnick TR, Calzada JI, Stone EM. Autosomal recessive best vitelliform macular dystrophy: report of a family and management of early-onset neovascular complications. Arch Ophthalmol. 2011; 129: 211–217 - PubMed
    1. Chung MM, Oh KT, Streb LM, Kimura AE, Stone EM. Visual outcome following subretinal hemorrhage in Best disease. Retina. 2001; 21: 575–580 - PubMed

Publication types

MeSH terms