. 2013 Sep;68(9):2118-27.
doi: 10.1093/jac/dkt155. Epub 2013 Apr 30.

Rapid in vivo assessment of drug efficacy against Mycobacterium tuberculosis using an improved firefly luciferase

Affiliations

Rapid in vivo assessment of drug efficacy against Mycobacterium tuberculosis using an improved firefly luciferase

Nuria Andreu et al. J Antimicrob Chemother. 2013 Sep.

Abstract

Objectives: In vivo experimentation is costly and time-consuming, and presents a major bottleneck in anti-tuberculosis drug development. Conventional methods rely on the enumeration of bacterial colonies, and it can take up to 4 weeks for Mycobacterium tuberculosis to grow on agar plates. Light produced by recombinant bacteria expressing luciferase enzymes can be used as a marker of bacterial load, and disease progression can be easily followed non-invasively in live animals by using the appropriate imaging equipment. The objective of this work was to develop a bioluminescence-based mouse model of tuberculosis to assess antibiotic efficacy against M. tuberculosis in vivo.

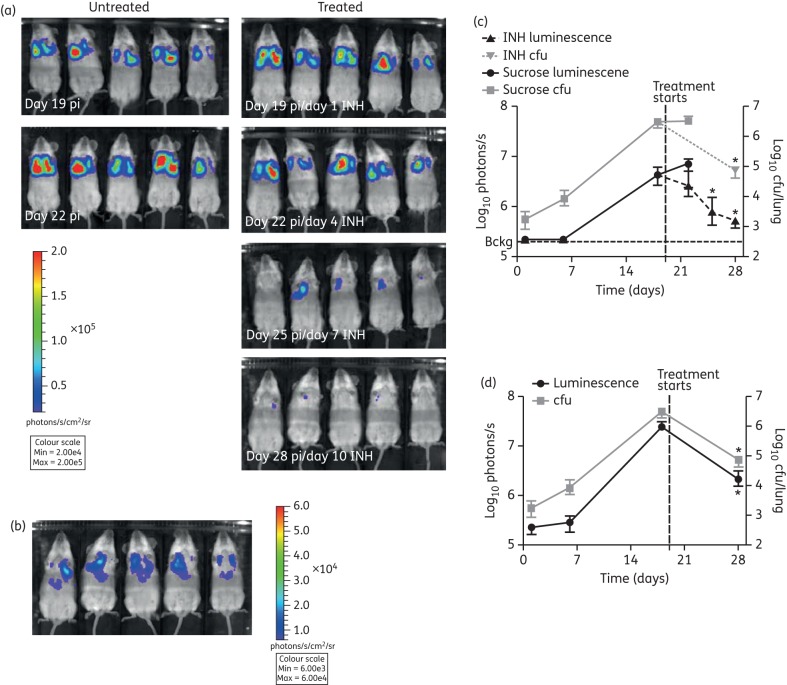
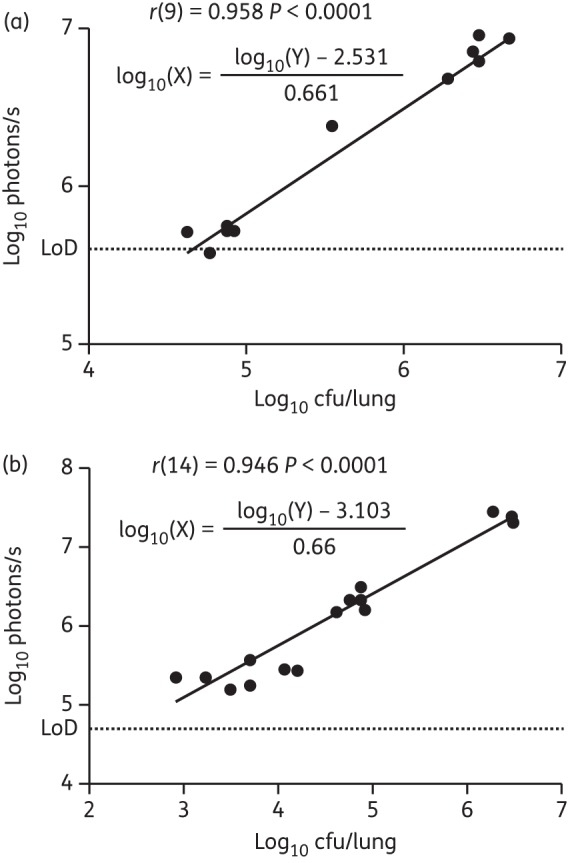
Methods: We used an M. tuberculosis strain carrying a red-shifted derivative of the firefly luciferase gene (FFlucRT) to infect mice, and monitored disease progression in living animals by bioluminescence imaging before and after treatment with the frontline anti-tuberculosis drug isoniazid. The resulting images were analysed and the bioluminescence was correlated with bacterial counts.

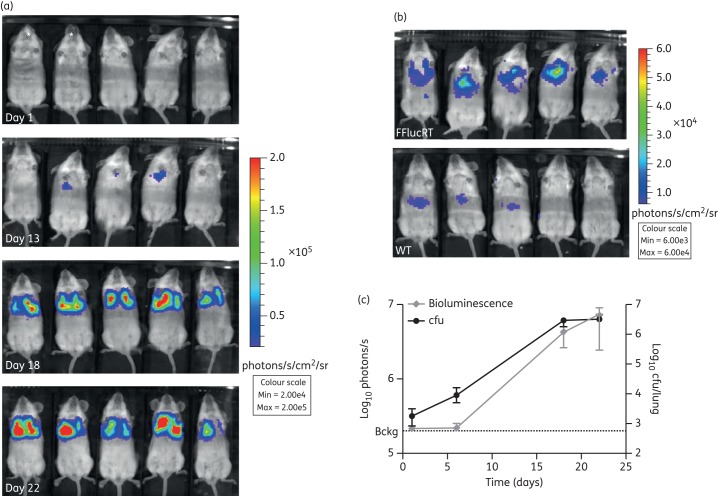
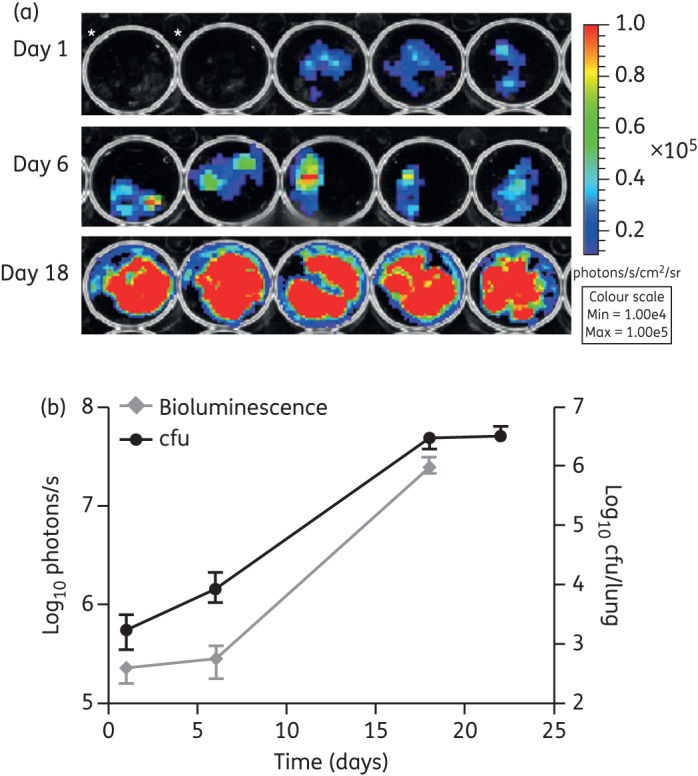
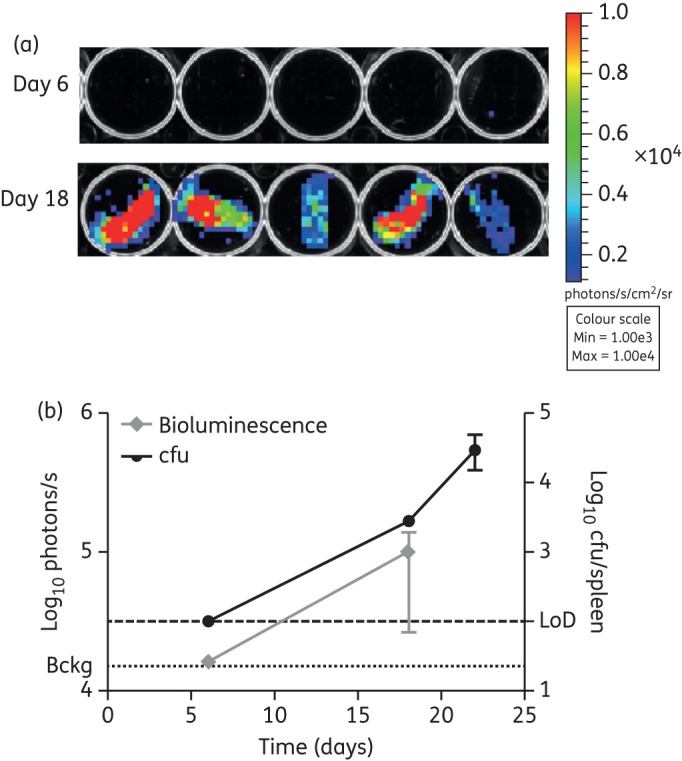
Results: Using bioluminescence imaging we detected as few as 1.7 × 10(3) and 7.5 × 10(4) reporter bacteria ex vivo and in vivo, respectively, in the lungs of mice. A good correlation was found between bioluminescence and bacterial load in both cases. Furthermore, a marked reduction in luminescence was observed in living mice given isoniazid treatment.

Conclusions: We have shown that an improved bioluminescent strain of M. tuberculosis can be visualized by non-invasive imaging in live mice during an acute, progressive infection and that this technique can be used to rapidly visualize and quantify the effect of antibiotic treatment. We believe that the model presented here will be of great benefit in early drug discovery as an easy and rapid way to identify active compounds in vivo.

Keywords: bioluminescence; drug testing; mouse model; optical imaging.


Figures

Figure 1.
Figure 1.
FFlucRT bioluminescence correlates with cell density. Cultures of M. tuberculosis pMV306G13 + FFlucRT, M. tuberculosis pMV306G13 + FFluc and M. tuberculosis H37Rv (WT) were inoculated at an OD of 0.01, and the OD and luminescence were measured over 9 days. The plots represent the means and standard deviations of values for three independent cultures, and values are plotted on a logarithmic scale. BL, bioluminescence.
Figure 2.
Figure 2.
Growth of M. tuberculosis in SCID mice is not affected by the expression of the FFlucRT reporter. SCID mice were infected with 1.1 × 104 cfu of M. tuberculosis pMV306G13 + FFlucRT or with 1.0 × 104 cfu of the parental M. tuberculosis WT via the intranasal route. Bacterial burden was determined by serial dilution plating of organ homogenates. Each point on the graph represents the median and range (n = 5 mice). This result is representative of two independent experiments. Statistical significance was evaluated by the Mann–Whitney test and those found to be significant (P < 0.05) are indicated with an asterisk.
Figure 3.
Figure 3.
In vivo imaging of M. tuberculosis infection. SCID mice were infected with 1.1 × 104 cfu of M. tuberculosis pMV306G13 + FFlucRT or with 1.0 × 104 cfu of M. tuberculosis WT via the intranasal route. (a) Mice were injected intraperitoneally with 500 mg/kg d-luciferin, and images were acquired using an IVIS® Spectrum system. *M. tuberculosis WT-infected mice; all others infected with M. tuberculosis pMV306G13 + FFlucRT. Day 1 and 6 images were very similar. Only day 1 is shown here. (b) The scale on the images shown here has been adjusted to demonstrate that a detectable signal was observed in the lungs of all five mice as early as day 13. M. tuberculosis pMV306G13 + FFlucRT-infected mice are the same mice as shown in (a). The signal in the abdomen of the mice comes from the liver due to background luminescence from the luciferin substrate. (c) Bioluminescence in the thorax was quantified for each mouse at each timepoint and compared with cfu data at corresponding timepoints. Each point on the graph represents the median and error (n = 5 mice). This result is representative of two independent experiments. Bckg, background luminescence (2 × 105 photons/s). This figure appears in colour in the online version of JAC and in black and white in the printed version of JAC.
Figure 4.
Figure 4.
Ex vivo bioluminescence in infected lungs. (a) Images of lungs harvested from the mice in Figure 3 were acquired using an IVIS® Spectrum system at multiple timepoints following infection. *M. tuberculosis WT-infected mice; all others infected with M. tuberculosis pMV306G13 + FFlucRT. (b) Bioluminescence (measured as photons/s) compared with cfu data at corresponding timepoints. cfu data are the same data as in Figure 3, but are included here for comparison. The background luminescence (1.5 × 104 photons/s) is outside the axis limits. Each point on the graph represents the median and range (n = 5 mice). This result is representative of two independent experiments. This figure appears in colour in the online version of JAC and in black and white in the printed version of JAC.
Figure 5.
Figure 5.
Ex vivo bioluminescence in infected spleens. (a) Images of spleens harvested from the mice in Figure 3 infected with M. tuberculosis pMV306G13 + FFlucRT were acquired using an IVIS® Spectrum system at multiple timepoints following infection. (b) Bioluminescence (measured as photons/s) was quantified for each spleen and compared with cfu data at corresponding timepoints. Each point on the graph represents the median and range (n = 4–5 mice). Bckg, background luminescence (1.3 × 104 photons/s); LoD, limit of detection (100 cfu). This figure appears in colour in the online version of JAC and in black and white in the printed version of JAC.
Figure 6.
Figure 6.
Effects of drug treatment were detected non-invasively in live mice by bioluminescent imaging. M. tuberculosis pMV306G13 + FFlucRT-infected SCID mice were treated daily with 25 mg/kg isoniazid (INH) by oral gavage from day 19 post-infection (pi). A control group was treated with sucrose. (a) To visualize the effect of INH treatment, mice were injected intraperitoneally with 500 mg/kg d-luciferin, and images were acquired using an IVIS® Spectrum system. (b) The scale on the images shown here has been adjusted to demonstrate that a detectable signal was observed in the lungs of all five mice on day 28 post-infection, when the bacterial load was just 7.5 × 104 cfu/lung. The mice are the same mice as shown in (a). The reduction in bacterial burden quantified in live mice (c) or lungs ex vivo (d) by bioluminescent imaging was confirmed by enumerating lung cfu. Each point on the graphs represents the median and range (n = 3–5 mice). Bckg, background luminescence in live mice (2 × 105 photons/s). The background luminescence in the lungs ex vivo (1.5 × 104 photons/s) is outside the axis limits. Statistical significance was evaluated by the Mann–Whitney test and those found to be significant (P < 0.05) are indicated with an asterisk. This figure appears in colour in the online version of JAC and in black and white in the printed version of JAC.
Figure 7.
Figure 7.
In vivo and ex vivo bioluminescence correlates with bacterial burden. Correlation of cfu in the lungs and bioluminescence in the thorax (a) or in the harvested lungs (b) of infected mice shown in Figures 3 and 6. The number of cfu X for a given bioluminescence measurement Y is described by the equation shown, which was obtained from linear regression analysis.

References

    1. WHO. Tuberculosis Fact Sheet. http://www.who.int/mediacentre/factsheets/fs104/en/index.html. (10 April 2013, date last accessed)
    1. Andreu N, Zelmer A, Wiles S. Noninvasive biophotonic imaging for studies of infectious disease. FEMS Microbiol Rev. 2011;35:360–94. - PMC - PubMed
    1. Rice BW, Cable MD, Nelson MB. In vivo imaging of light-emitting probes. J Biomed Opt. 2001;6:432–40. - PubMed
    1. Zhao H, Doyle TC, Coquoz O, et al. Emission spectra of bioluminescent reporters and interaction with mammalian tissue determine the sensitivity of detection in vivo. J Biomed Opt. 2005;10:41210. - PubMed
    1. Prioli RP, Tanna A, Brown IN. Rapid methods for counting mycobacteria–comparison of methods for extraction of mycobacterial adenosine triphosphate (ATP) determined by firefly luciferase assay. Tubercle. 1985;66:99–108. - PubMed

Publication types

Associated data