. 2013 May;15(5):491-501.
doi: 10.1593/neo.13314.

The role of sarcosine metabolism in prostate cancer progression

Affiliations

The role of sarcosine metabolism in prostate cancer progression

Amjad P Khan et al. Neoplasia. 2013 May.

Abstract

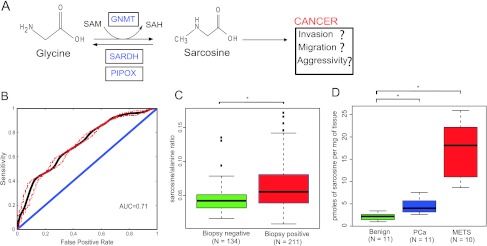
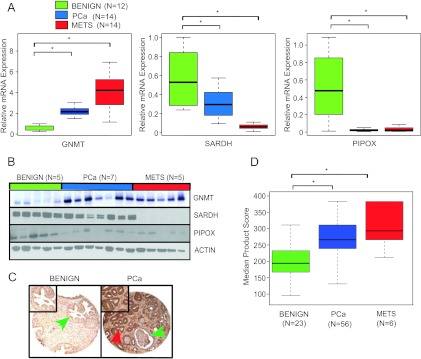
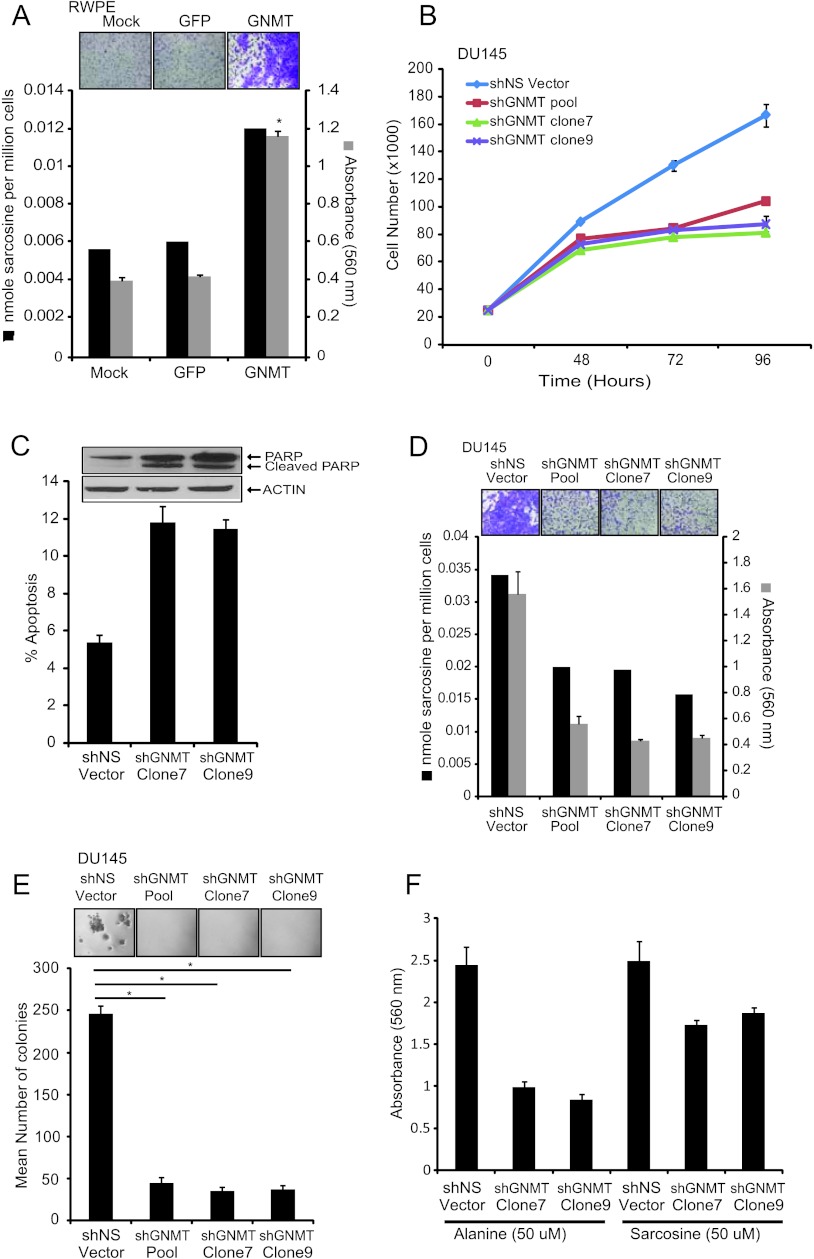
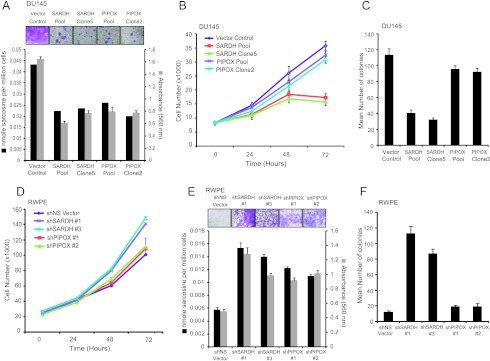
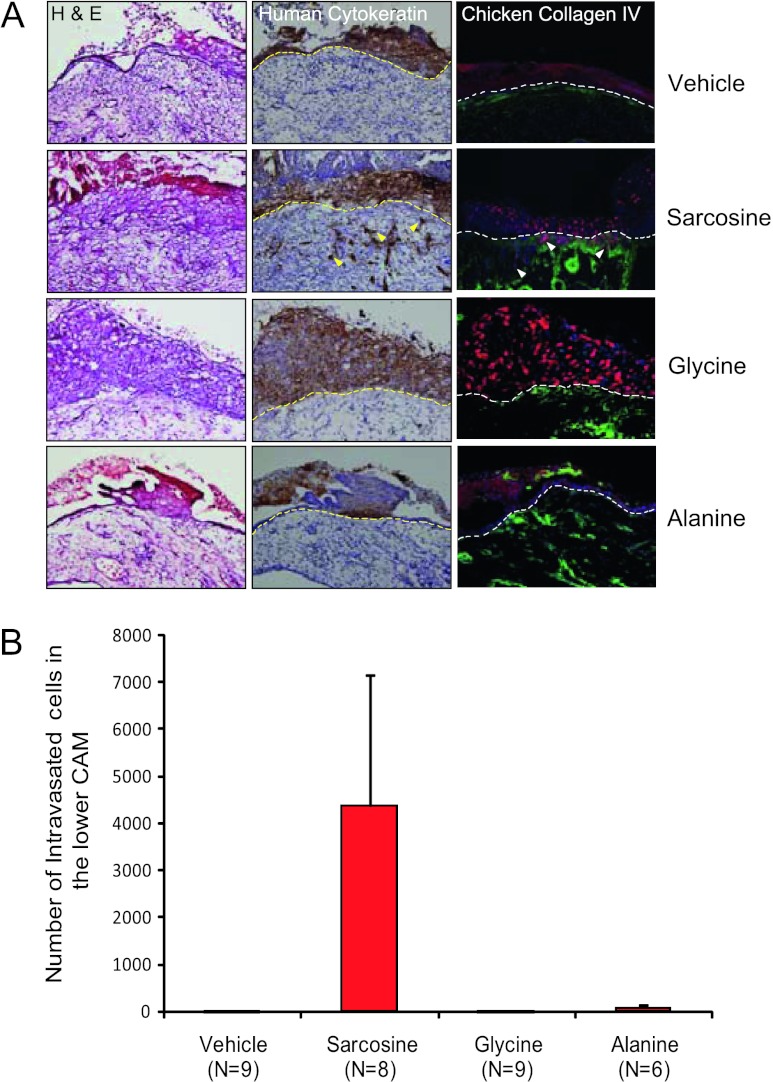
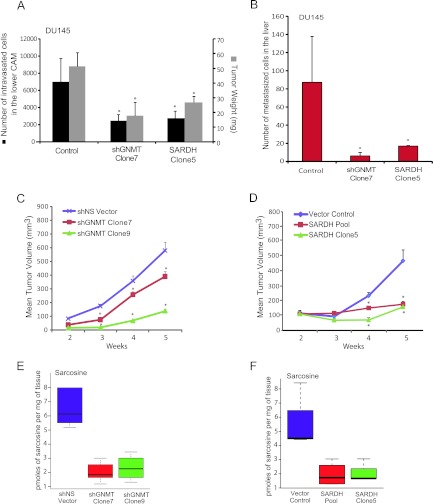
Metabolomic profiling of prostate cancer (PCa) progression identified markedly elevated levels of sarcosine (N-methyl glycine) in metastatic PCa and modest but significant elevation of the metabolite in PCa urine. Here, we examine the role of key enzymes associated with sarcosine metabolism in PCa progression. Consistent with our earlier report, sarcosine levels were significantly elevated in PCa urine sediments compared to controls, with a modest area under the receiver operating characteristic curve of 0.71. In addition, the expression of sarcosine biosynthetic enzyme, glycine N-methyltransferase (GNMT), was elevated in PCa tissues, while sarcosine dehydrogenase (SARDH) and pipecolic acid oxidase (PIPOX), which metabolize sarcosine, were reduced in prostate tumors. Consistent with this, GNMT promoted the oncogenic potential of prostate cells by facilitating sarcosine production, while SARDH and PIPOX reduced the oncogenic potential of prostate cells by metabolizing sarcosine. Accordingly, addition of sarcosine, but not glycine or alanine, induced invasion and intravasation in an in vivo PCa model. In contrast, GNMT knockdown or SARDH overexpression in PCa xenografts inhibited tumor growth. Taken together, these studies substantiate the role of sarcosine in PCa progression.


Figures

Figure 1
Figure 1
Levels of sarcosine and its pathway enzymes in PCa progression. (A) Schematic representation of the sarcosine pathway and its potential role in PCa. (B) Receiver operating characteristic curve for sarcosine in the 345 urine sediments from 211 biopsy-positive and 134 biopsy-negative individuals. Sarcosine has an AUC of 0.71. (C) Box plot showing significantly (P < .0001) higher levels of sarcosine relative to alanine in urine sediments from biopsy-proven PCa and prostate biopsy-negative controls. (D) Box plot showing progressive elevation of sarcosine during progression from benign to localized (PCa) to MET samples (benign vs PCa, P = .0006 and benign vs METS, P < .00001).
Figure 2
Figure 2
GNMT, SARDH, and PIPOX mRNA and protein expression are dysregulated in PCa. (A) Quantitative SYBR Green reverse transcription-PCR (qRT-PCR) assessment of GNMT, SARDH, and PIPOX expression in prostate tumor specimens. Expression was determined in a cohort of 12 benign adjacent prostate (benign), 14 localized PCa, and 14 metastatic PCa (MET) tissues. For qRT-PCR, expression of target genes was normalized to the expression of the housekeeping gene, GAPDH. (B) Immunoblot analysis showing GNMT, SARDH, and PIPOX expression in benign, PCA, and MET. The protein levels of actin were used as loading control. (C) Representative prostate tissue sections stained with an antibody to GNMT. (Left) GNMT expression in benign tissue was observed primarily in cytoplasm (green arrow). (Right) In clinically localized PCa, the expression of GNMT was increased in the cytoplasm (red arrow) compared to weak expression in benign gland from the same sample (green arrow). (D) Box plot of GNMT product score across PCa progression.
Figure 3
Figure 3
The role of the sarcosine-generating enzyme, GNMT, in prostate cell lines. (A) Benign immortalized prostate RWPE cells were transduced with GFP-GNMT lentivirus or mock or GFP control. Increased levels of sarcosine were found in GFP-GNMT lentivirus-transduced RWPE cells compared to mock or GFP control. GNMT overexpression also increased invasion in RWPE cells as measured by Boyden chamber Matrigel invasion assay. Representative photomicrographs showing cell invasion assay (top inset) are shown. (B) Cell proliferation assay using pooled shGNMT, shGNMT clone 7, shGNMT clone 9, or shNS cells at the indicated time points showing decreased cell proliferation in shGNMT knockdown cells. (C) shGNMT clone 7 and shGNMT clone 9 or shNS DU14 cells were plated for 48 hours. The amount of sub-G0/G1 cells was calculated using the CellQuest program for fluorescence-activated cell sorting (FACS). Cleavage of PARP by immunoblot assessment is shown in the top inset. (D) Assessment of sarcosine levels by GC-MS showing decreased levels of sarcosine in shGNMT knockdown cells compared to shNS vector. The invasion was quantitated by absorbance and cells were photographed after invasion through Matrigel and stained with crystal violet (top inset). (E) Pooled shGNMT, shGNMT clone 7, or shGNMT clone 9 blocked anchorage-independent growth in soft agar assay compared to shNS vector control. Representative photomicrographs showing soft agar (top inset) are shown. All experiments were independently performed in triplicates. (F) Exogenous sarcosine or alanine was spiked to shGNMT clone 7 or shGNMT clone 9 cells and invasion assay was performed. The addition of sarcosine resulted in the rescue of invasion phenotype in these GNMT knockdown cells. Data shown in the figure represent means ± SEM. Asterisks indicate significant comparisons (P < .05, two-sided Student's t test).
Figure 4
Figure 4
The role of the sarcosine-degrading enzymes, SARDH and PIPOX, in prostate cell lines. (A) FLAG-SARDH and FLAG-PIPOX overexpressing cells showed decreased levels of sarcosine and attenuated invasion in DU145 cells. The invasion was quantitated by absorbance and cells were photographed after invasion through Matrigel and stained with crystal violet (top inset). (B) FLAG-SARDH and FLAG-PIPOX were stably overexpressed in DU145 cells. Cell proliferation assay performed using pooled SARDH, SARDH clone 5, pooled PIPOX, PIPOX clone 2, or vector control cells at the indicated time points showed decreased cell proliferation in SARDH but not PIPOX overexpressing cells. (C) Pooled SARDH or SARDH clone 5 showed decreased number of colonies in soft agar compared to vector control. (D) Same as in B but for shSARDH knockdown RWPE cells (clones 1 and 3) and shPIPOX knockdown RWPE cells (clones 1 and 2) or their respective shNS controls at the indicated time points. (E) Same as in A but for shSARDH and shPIPOX knockdown RWPE cells compared to their respective shNS controls. (F) Same as in C but for shSARDH and shPIPOX knockdown RWPE cells compared to their respective shNS controls.
Figure 5
Figure 5
The role of sarcosine in PCa growth in vivo. (A) CAM invasion assay performed using RWPE cells transduced with red fluorescent protein virus for visualization. After puromycin selection, cells were treated with vehicle, sarcosine, glycine, or alanine as indicated. Seventy-two hours after implantation, the upper CAM was harvested. Frozen sections were created and stained for hematoxylin and eosin (left column), human-specific cytokeratin (immunohistochemistry, middle column), or chicken-specific type IV collagen (green immunofluorescence, right column). Arrowheads indicate cells that invaded through the upper CAM. Representative images are shown. Scale bars, 200 µM. (B) CAM intravasation assay performed using RWPE cells treated with vehicle, sarcosine, glycine, or alanine as indicated. Seventy-two hours after implantation, the lower CAM was harvested. Total DNA was isolated from the lower CAM, and qPCR was performed using human-specific Alu PCR primers. Total cell number was determined by comparing to a standard curve derived by using known quantities of input RWPE cells.
Figure 6
Figure 6
The role of sarcosine pathway enzymes, GNMT and SARDH, in PCa growth in vivo. (A) CAM intravasation assay was performed using shGNMT clone 7, SARDH clone 5, and vector control in DU145 cells. Number of intravasated DU145 cells and tumor weight was decreased in both shGNMT and SARDH overexpressing xenografted cell lines compared to vector control. (B) Liver metastasis in chicken embryos was assessed 8 days following implantation of either shGNMT clone 7 or SARDH clone 5 or vector control cells onto the upper CAM. Total number of metastasized cells were quantified and found to be significantly decreased in both shGNMT and SARDH overexpressing xenografted cell lines compared to vector control. (C) shGNMT (clones 7 and 9) decreased DU145 tumor growth in mice. Means ± SEM are shown, *P < .05. (D) Stably overexpressed SARDH (pool and clone 5) decreased DU145 tumor growth in mice. Means ± SEM are shown, *P < .05. (E) Box plots showing decreased sarcosine levels in shGNMT (clones 7 and 9) mouse xenograft compared to shNS vector control. (F) Box plot showing decreased sarcosine levels in SARDH overexpressed (pool and clone 5) mouse xenograft tumors compared to vector control.

Similar articles

Cited by

References

    1. Jemal A, Bray F, Center MM, Ferlay J, Ward E, Forman D. Global cancer statistics. CA Cancer J Clin. 2011;61:69–90. - PubMed
    1. Abate-Shen C, Shen MM. Molecular genetics of prostate cancer. Genes Dev. 2000;14:2410–2434. - PubMed
    1. Abate-Shen C, Shen MM. Diagnostics: the prostate-cancer metabolome. Nature. 2009;457:799–800. - PubMed
    1. Sreekumar A, Poisson LM, Rajendiran TM, Khan AP, Cao Q, Yu J, Laxman B, Mehra R, Lonigro RJ, Li Y, et al. Metabolomic profiles delineate potential role for sarcosine in prostate cancer progression. Nature. 2009;457:910–914. - PMC - PubMed
    1. Jentzmik F, Stephan C, Lein M, Miller K, Kamlage B, Bethan B, Kristiansen G, Jung K. Sarcosine in prostate cancer tissue is not a differential metabolite for prostate cancer aggressiveness and biochemical progression. J Urol. 2011;185:706–711. - PubMed

Supplemental Reference

    1. Sreekumar A, Poisson LM, Rajendiran TM, Khan AP, Cao Q, Yu J, Laxman B, Mehra R, Lonigro RJ, Li Y, et al. Metabolomic profiles delineate potential role for sarcosine in prostate cancer progression. Nature. 2009;457:910–914. - PMC - PubMed

Publication types

MeSH terms