. 2013;9(4):e1003417.
doi: 10.1371/journal.pgen.1003417. Epub 2013 Apr 25.

High-resolution mapping of h1 linker histone variants in embryonic stem cells

Affiliations

High-resolution mapping of h1 linker histone variants in embryonic stem cells

Kaixiang Cao et al. PLoS Genet. 2013.

Abstract

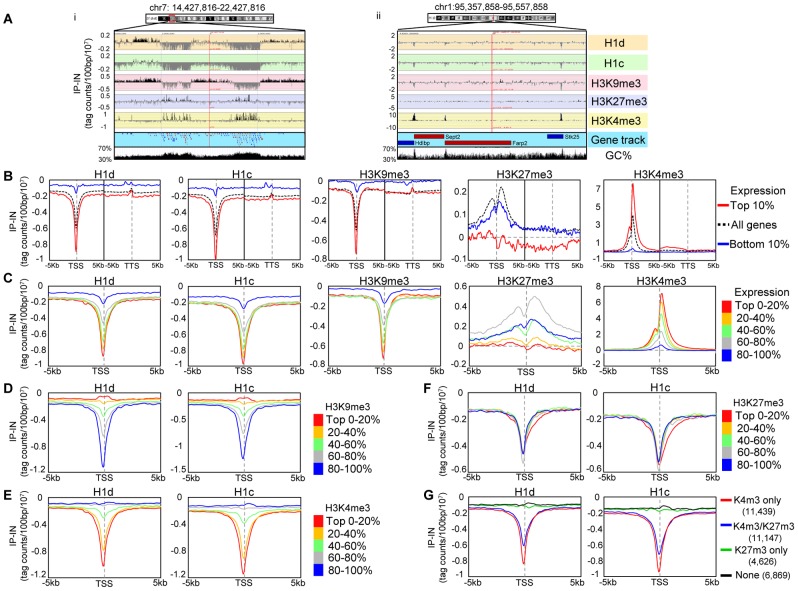
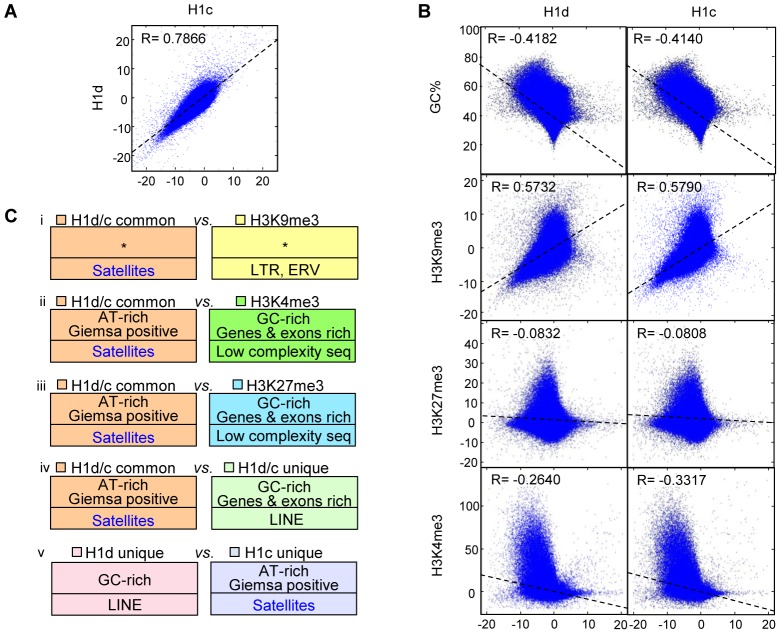
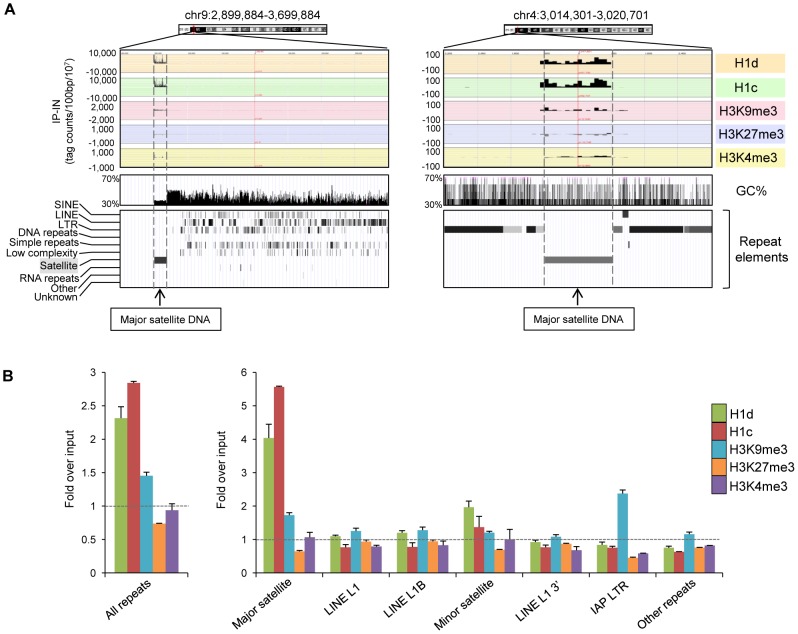
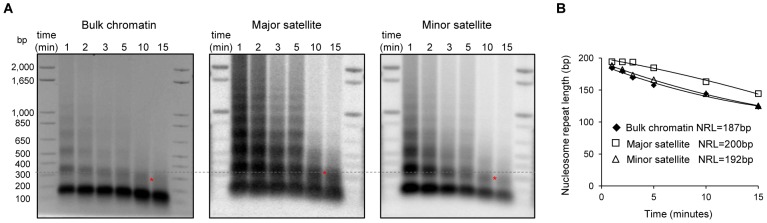
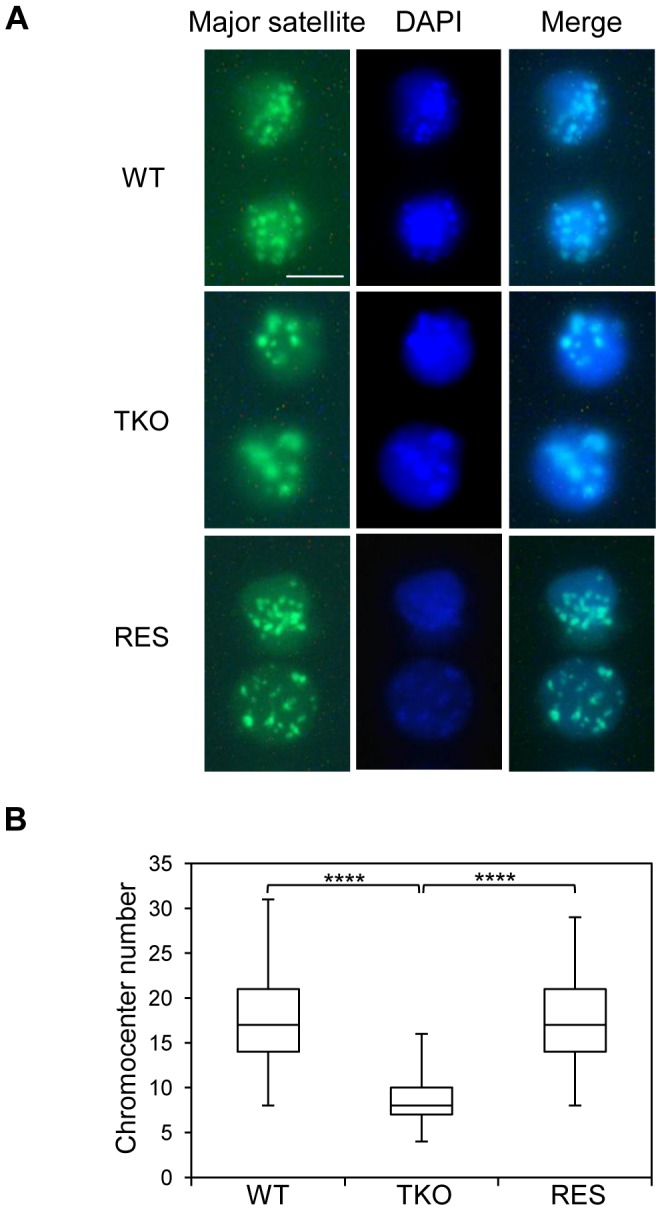
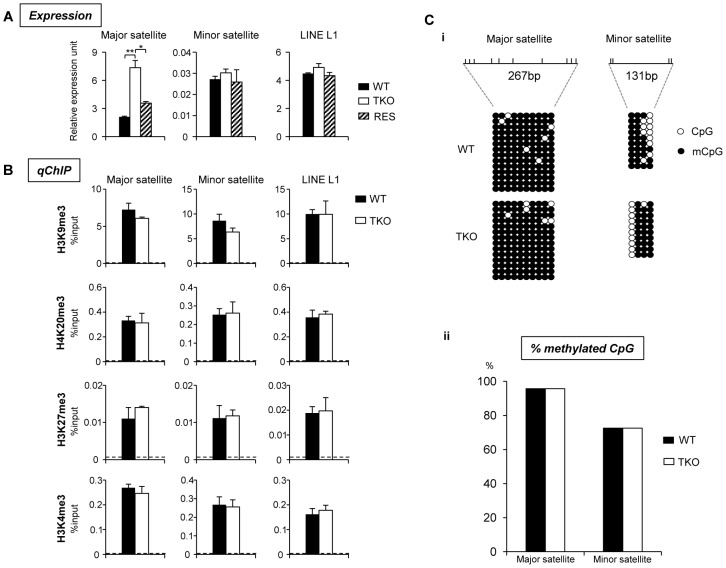
H1 linker histones facilitate higher-order chromatin folding and are essential for mammalian development. To achieve high-resolution mapping of H1 variants H1d and H1c in embryonic stem cells (ESCs), we have established a knock-in system and shown that the N-terminally tagged H1 proteins are functionally interchangeable to their endogenous counterparts in vivo. H1d and H1c are depleted from GC- and gene-rich regions and active promoters, inversely correlated with H3K4me3, but positively correlated with H3K9me3 and associated with characteristic sequence features. Surprisingly, both H1d and H1c are significantly enriched at major satellites, which display increased nucleosome spacing compared with bulk chromatin. While also depleted at active promoters and enriched at major satellites, overexpressed H1(0) displays differential binding patterns in specific repetitive sequences compared with H1d and H1c. Depletion of H1c, H1d, and H1e causes pericentric chromocenter clustering and de-repression of major satellites. These results integrate the localization of an understudied type of chromatin proteins, namely the H1 variants, into the epigenome map of mouse ESCs, and we identify significant changes at pericentric heterochromatin upon depletion of this epigenetic mark.


Conflict of interest statement

The authors have declared that no competing interests exist.

Figures

Figure 1
Figure 1. Generation of H1dFLAG knock-in ESCs.
(A) Schematic representation of the H1dFLAG targeting construct and the knock-in strategy for insertion of the FLAG tag at N-terminus of the endogenous H1d gene. (B) Identification of ESC clones containing the modified FLAG-H1d allele. DNA isolated from Blasticidin resistant ESC clones were analyzed by Southern blotting. Cis vs. trans configurations of the homologous recombination events are schematically illustrated in the diagram above the Southern blotting image. (C) Reverse phase HPLC profiles of histone extracts from cehet (left panel) and cis-targeted H1dFLAG ESCs (right panel). mU, milliunits of absorbency at 214 nm. (D) Coomassie staining and Western blotting analysis of individual H1 fractions eluted from HPLC of histone extracts of cehet (1) and H1dFLAG (2) ESCs. (E) Calculated ratio of each H1 variant (and total H1) to nucleosome of cehet and H1dFLAG ESCs.
Figure 2
Figure 2. H1 is depleted at GC-rich, gene-rich regions and TSSs of active promoters.
(A) Examples of distributions of H1 variants and histone marks at an 8 Mb- (i) and a 200 kb- (ii) region. The GC density track was obtained from UCSC genome browser. Genes are color coded according to their transcription directions (Red: sense strand; Blue: anti-sense strand). (B–C) Metagene analysis of H1d, H1c, H3K9me3, H3K27me3 and H3K4me3 in relation to gene expression levels. TSS: transcription start site. TTS: transcription termination site. B) Profiles of highly active genes (top 10% in expression), silent genes (bottom 10% in expression) and all genes on a 10 kb window around TSS and a 10 kb window around TTS. C) Profiles of genes finely grouped according to expression levels on a 10 kb window centered on TSSs. (D–G) Metagene analysis of H1d and H1c in relation to the levels of H3K9me3 (D), H3K4me3 (E), H3K27me3 (F), and the presence or absence of H3K4me3 and H3K27me3 (G), on regions covering −5 kb to +5 kb of TSS. The number of genes selected within each group in (G) is shown in parentheses. Y axis: tag counts per 100 bp window per 10 million mappable reads. IP-IN: normalized signal values of ChIP-seq subtracted by that of input-seq.
Figure 3
Figure 3. Correlation and over-representation analyses of H1 variants and histone marks.
(A–B) Genome-wide correlation scatter plots of H1d vs. H1c (A), and GC% (or histone marks) vs. H1d (left) and H1c (right) (B). The correlation coefficient and the trend line were generated as described in methods. X and Y axes: average signal values (normalized to 100 bp window). Pearson's correlation was used to perform the analysis. P<10−100 for all correlation coefficient. (C) Overrepresented features from the following 5 comparisons of H1 or histone mark highly enriched regions; i) H1d/H1c common vs. H3K9me3 regions; ii) H1d/H1c common vs. H3K4me3 regions; iii) H1d/H1c common vs. H3K27me3 regions; iv) H1d/H1c common vs. H1d/H1c unique regions; v) H1d unique vs. H1c unique regions. Bottom half of each box: repetitive elements. *: no significant overrepresentation. All P values remained significant after multiple testing corrections with the FDR method and the more conservative Bonferroni method.
Figure 4
Figure 4. H1d and H1c are enriched at the major satellite sequences.
(A) Representative profiles of top H1d and H1c enriched regions (mapped to mm9). Repeat element tracks were obtained from UCSC genome browser. Dashed lines indicate the localization of these H1 peaks at major satellite sequences. (B) Fold enrichment of percent mappable repeats (mapped to RepBase) from H1d, H1c, and histone marks ChIP-seq libraries over that from corresponding chromatin input-seq library on all repeats (left), six most abundant repetitive sequences and the remaining other repeats (right). The dashed lines indicate the level of normalized input signal. P values calculated with Fisher's exact test comparing ChIP-seq with input-seq libraries are less than 2.5×10⁻⁵ for all repeat classes shown. Error bars represent the differences between replicates. Data are presented as average ± S.E.M.
Figure 5
Figure 5. Increased nucleosome repeat length at major satellite repeats in ESCs.
(A) Nucleosome repeat length analyses of bulk chromatin (left), major satellite sequences (middle) and minor satellite sequences (right) in WT ESCs. DNA isolated from ESC nuclei digested with MNase at different time points were analyzed by ethidium bromide (EB) –stained gel (left), transferred to membrane which was sequentially probed with major satellites (middle) and minor satellites (right) using Southern blotting. The positions of di-nucleosomes with 10-minute MNase digestion are marked by *. The dashed line indicates di-nucleosome position of major satellites, which is higher than that of bulk chromatin and minor satellites. (B) The NRLs were calculated from the images presented in (A) by extrapolating the corresponding curves to time “0” as described .
Figure 6
Figure 6. H1 depletion leads to chromocenter clustering.
(A) Typical images of WT (top), H1 TKO (middle), and RES ESCs (bottom) of FISH with a major satellite probe (left), DNA stain DAPI (middle), and merged images (right). Scale bar: 10 µm. (B) Box plots of chromocenter numbers in the nuclei of WT, H1 TKO, and RES ESCs. The line in the box indicates the median, while the bottom and top of the boxes are the 25th and 75th percentiles, respectively. ****: P<0.000001.
Figure 7
Figure 7. H1 depletion leads to increased expression of major satellite repeats independent of multiple epigenetic marks.
(A) Analyses of expression of selected repeats in WT, H1 TKO, and RES ESCs by qRT-PCR. Data are represented as mean +/− S. D.. *: P<0.05; **: P<0.01. (B) qChIP analysis of three repressive histone marks and one active histone mark at selected repetitive sequences in WT and H1 TKO ESCs. Dashed lines indicate the highest level of signals detected by qChIP with IgG antibody. (C) Bisulfite sequencing analysis (i) and percent of methylated CpG (ii) of major, minor satellite sequences. The positions of CpG sites analyzed are marked as vertical ticks on the line.

Similar articles

Cited by

References

    1. Wolffe AP (1998) Chromatin: Structure and Function. San Diego, CA: Academic Press.
    1. van Holde KE (1989) Chromatin: New York: Springer-Verlag.
    1. Bednar J, Horowitz RA, Grigoryev SA, Carruthers LM, Hansen JC, et al. (1998) Nucleosomes, linker DNA, and linker histone form a unique structural motif that directs the higher-order folding and compaction of chromatin. Proc Natl Acad Sci U S A 95: 14173–14178. - PMC - PubMed
    1. Robinson PJ, Fairall L, Huynh VA, Rhodes D (2006) EM measurements define the dimensions of the “30-nm” chromatin fiber: evidence for a compact, interdigitated structure. Proc Natl Acad Sci U S A 103: 6506–6511. - PMC - PubMed
    1. Routh A, Sandin S, Rhodes D (2008) Nucleosome repeat length and linker histone stoichiometry determine chromatin fiber structure. Proc Natl Acad Sci U S A 105: 8872–8877. - PMC - PubMed

Publication types