. 2013 Apr 19;5(3):347-58.
Print 2013.

Novel insight into the distribution of L-cells in the rat intestinal tract

Affiliations

Novel insight into the distribution of L-cells in the rat intestinal tract

Carl Frederik Hansen et al. Am J Transl Res. .

Abstract

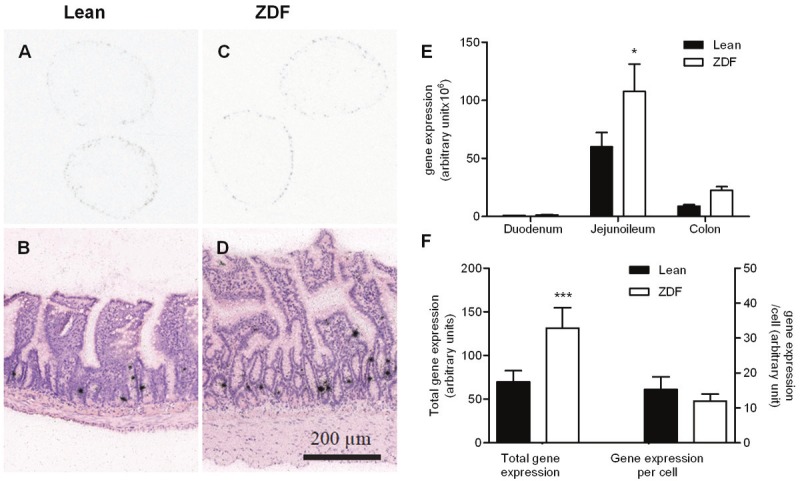
Background: Gut secreted incretin hormones and gastric bypass surgery currently provides some of the most successful treatments for diabetes and obesity respectively. However, despite the evident importance of the gut endocrine system no information exists on the total number and distribution of different types of endocrine cells in the gut. Here we have used the established preclinical Zucker Diabetic Fatty (ZDF) rat model which displays elevated levels of GLP-1 to assess L-cell distribution and L-cell dynamics in the full rostro-caudal extension of the rat intestinal tract.

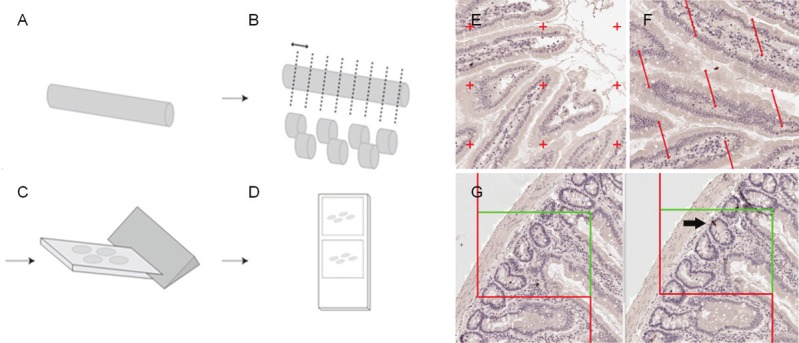
Methods: Using mathematically unbiased stereology we provide total and regional estimates of gut volume, gut surface area and the total number of L-cells throughout the intestinal tract in obese ZDF rats and lean controls.

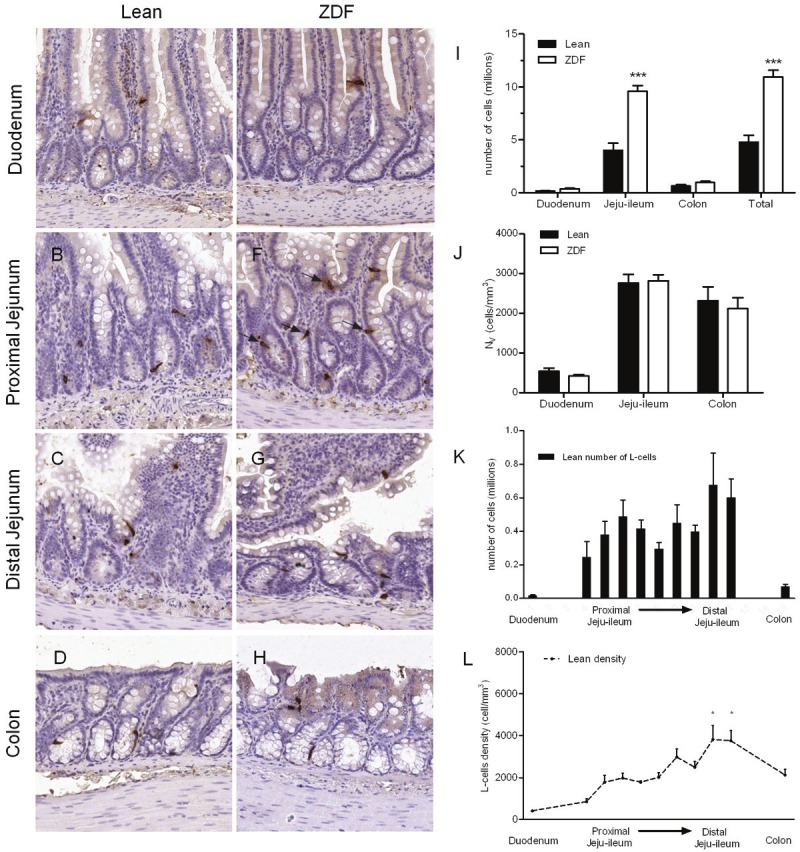
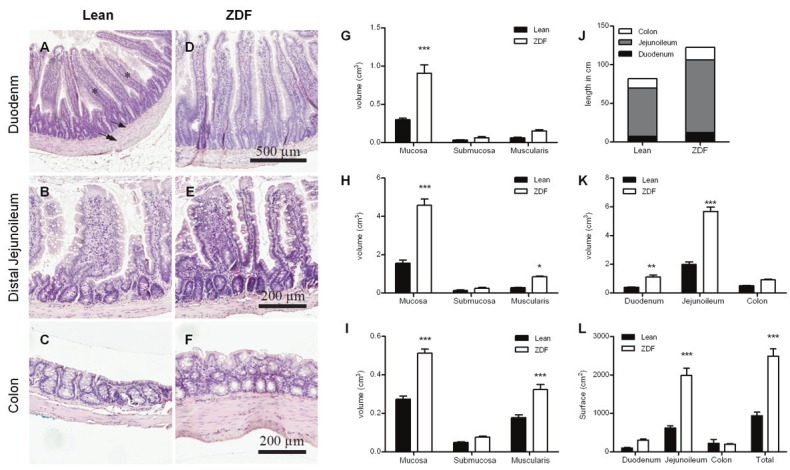
Results: The total number of L-cells in the lean and obese ZDF gut is estimated to 4.8 and 10.9 million, respectively, coupled with a corresponding near doubling in total gut volume and total surface area. L-cell numbers were found to be distributed rather evenly throughout the jejunum, ileum and colon.

Conclusion: The present study provides the first stereological report of total L-cell number and L-cell distribution throughout the rat intestinal tract. In contrast to the currently held view, the majority of L-cells are actually located proximal to the traditionally defined ileum and colon.

Keywords: GLP-1; L-cell; ZDF; diabetes; stereology.


Figures

Figure 1
Figure 1
Tissue sampling and stereological probes. The intestinal tract was divided into the duodenum, jejunoileum and colon (A), embedded in agar and divided by systematically uniform random sampling into eight slabs (B). Each slab was embedded on their cut surface in paraffin and cut (C) into single or paired consecutive sections (D). Regional and specific cellular layer volume (i.e. the mucosa, submucosa and muscularis) was estimated by point counting (E). Surface area was estimated by counting intersections between line probes and the mucosal surface (F), and number was estimated using the physical dissector on two paired neighbor sections (G). Arrow indicates the counting event where an immunoreactive cells is evident in one section and not the other.
Figure 2
Figure 2
L-cell density and numbers. Representative images from duodenum (A, E) proximal (B, F) and distal (C-G) jejunoileum and colon (D-H) in lean and diabetic ZDF rats. L-cells are stained for GLP-2 immunoreactivity (arrows). Regional and total L-cell number (I) and density (J). L-cell number in throughout the gut of the jejunoileum based on estimates on individual slabs, compared to the total number of cells in the duodenum and colon (K). L-cell density, displayed as line graph (L) with distal ileum tested significantly higher density than all other regions.
Figure 3
Figure 3
Volume of each of the cellular layers was quantified using stereological counting. Mucosa layer is marked with asterisk, submucosa by single arrow, and muscularis by double arrow. Representative images from duodenum (A, D), distal jejunoileum (B, E) and colon (C, F) in lean and diabetic ZDF rats counterstained with hematoxylin. Estimates of mucosa, submucosa and muscularis volumes in the duodenum (G), jejunoileum (H) and colon (I). Regional and total lengths of the intestinal segments (J) and stereological estimates of total regional volume (K). The total and regional intraluminal surface areas (L).
Figure 4
Figure 4
Gene expression analyses. Representative images of preproglucagon expression in the jejunoileum on autoradiographic film (A, C) and emulsion dipped sections (B, D). Regional total preproglucagon expression (E) and total gene expression (left axis) as well as expression per cell (right axis) (F).

References

    1. Sjostrom L. Bariatric surgery and reduction in morbidity and mortality: experiences from the SOS study. Int J Obes (Lond) 2008;32(Suppl 7):S93–97. - PubMed
    1. Pories WJ, Swanson MS, MacDonald KG, Long SB, Morris PG, Brown BM, Barakat HA, deRamon RA, Israel G, Dolezal JM, et al. Who would have thought it? An operation proves to be the most effective therapy for adult-onset diabetes mellitus. Ann Surg. 1995;222:339–350. discussion 350-352. - PMC - PubMed
    1. Kim S, Richards WO. Long-term follow-up of the metabolic profiles in obese patients with type 2 diabetes mellitus after Roux-en-Y gastric bypass. Ann Surg. 2010;251:1049–1055. - PubMed
    1. Buchwald H, Estok R, Fahrbach K, Banel D, Jensen MD, Pories WJ, Bantle JP, Sledge I. Weight and type 2 diabetes after bariatric surgery: systematic review and meta-analysis. Am J Med. 2009;122:248–256. 245. - PubMed
    1. Tharakan G, Tan T, Bloom S. Emerging therapies in the treatment of ‘diabesity’: beyond GLP-1. Trends Pharmacol Sci. 2011;32:8–15. - PubMed

LinkOut - more resources