. 2013 Jun 12;13(6):2634-9.
doi: 10.1021/nl4007744.

3D printed bionic ears

Affiliations

3D printed bionic ears

Manu S Mannoor et al. Nano Lett. .

Abstract

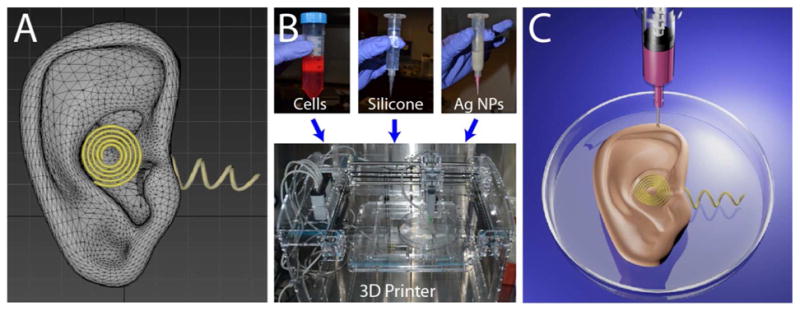
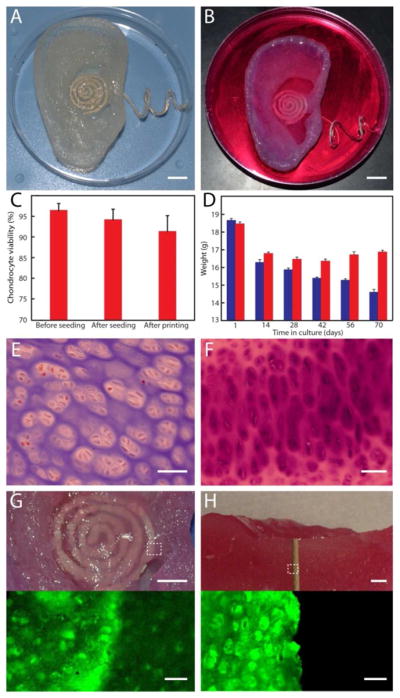
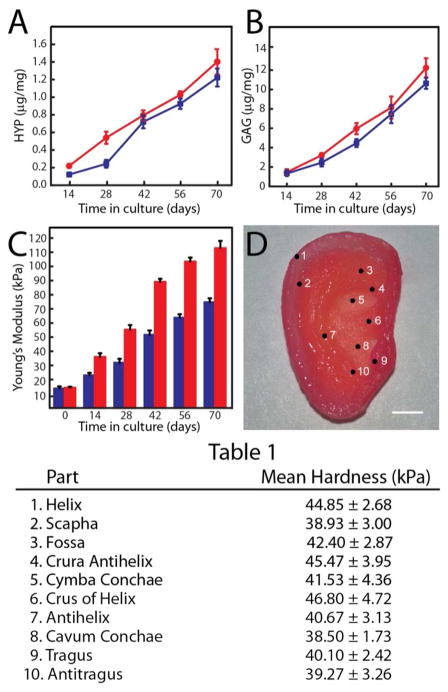
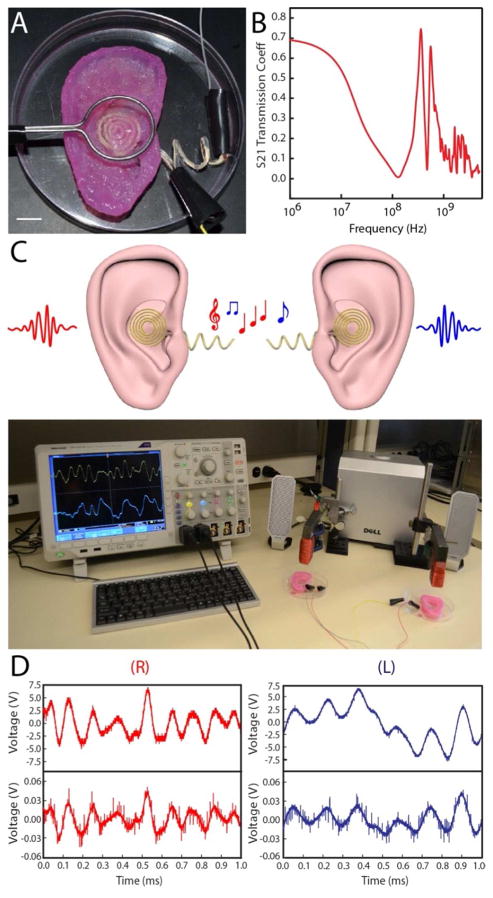
The ability to three-dimensionally interweave biological tissue with functional electronics could enable the creation of bionic organs possessing enhanced functionalities over their human counterparts. Conventional electronic devices are inherently two-dimensional, preventing seamless multidimensional integration with synthetic biology, as the processes and materials are very different. Here, we present a novel strategy for overcoming these difficulties via additive manufacturing of biological cells with structural and nanoparticle derived electronic elements. As a proof of concept, we generated a bionic ear via 3D printing of a cell-seeded hydrogel matrix in the anatomic geometry of a human ear, along with an intertwined conducting polymer consisting of infused silver nanoparticles. This allowed for in vitro culturing of cartilage tissue around an inductive coil antenna in the ear, which subsequently enables readout of inductively-coupled signals from cochlea-shaped electrodes. The printed ear exhibits enhanced auditory sensing for radio frequency reception, and complementary left and right ears can listen to stereo audio music. Overall, our approach suggests a means to intricately merge biologic and nanoelectronic functionalities via 3D printing.


Figures

Figure 1
Figure 1
Three-dimensional interweaving of biology and electronics via additive manufacturing to generate a bionic ear. (A) CAD drawing of the bionic ear. (B) (top) Optical images of the functional materials, including biological (chondrocytes), structural (silicone), and electronic (AgNPinfused silicone) used to form the bionic ear. (bottom) a 3D printer used for the printing process. (C) Illustration of the 3D printed bionic ear.
Figure 2
Figure 2
Growth and viability of the bionic ear. (A) Image of the 3D printed bionic ear immediately after printing. (B) Image of the 3D printed bionic ear during in vitro culture. Scale bars in (A) and (B) are 1 cm. (C) Chondrocyte viability at various stages of the printing process. Error bars show standard deviation with N=3. (D) Variation in the weight of the printed ear over time in culture, where the ear consists of chondrocyte-seeded alginate (red) or only alginate (blue). Error bars show standard deviation with N=3. (E) Histologic evaluation of chondrocyte morphology using H&E staining. (F) Safranin O staining of the neocartilaginous tissue after 10 weeks of culture. (G) Photograph (top) and fluorescent (bottom) images showing viability of the neocartilaginous tissue in contact with the coil antenna. (H) Photograph (top) and fluorescent (bottom) images of a cross section of the bionic ear showing viability of the internal cartilaginous tissue in contact with the electrode. Top scale bars are 5 mm; bottom are 50 μm.
Figure 3
Figure 3
Biomechanical characterization of the 3D printed neocartilage tissue. (A) Variation of HYP content over time in culture with 20 % (red) and 10 % (blue) FBS. (B) Variation of GAG content over time in culture with 20 % (red) and 10 % (blue) FBS. (C) Variation of Young’s modulus of 3D printed dog bone constructs over time in culture with 20 million (blue) and 60 million (red) cells/mL. Error bars for parts A-C show standard deviation with N=3. (D) Various anatomic sites of the ear auricle, with corresponding hardness listed in Table 1. Scale bar is 1 cm.
Figure 4
Figure 4
Electrical characterization of the bionic ear. (A) Image of the experimental setup used to characterize the bionic ear. The ear is exposed to a signal from a transmitting loop antenna. The output signal is collected via connections to two electrodes on the cochlea. Scale bar is 1 cm. (B) Response of the bionic ear to radio frequencies in terms of S21, the forward power transmission coefficient. (C) (top) Schematic representation of the radio signal reception of two complementary (left and right) bionic ears. (bottom) Photograph of complementary bionic ears listening to stereophonic audio music. (D) Transmitted (top) and received (bottom) audio signals of the right (R) and left (L) bionic ears.

References

    1. Lavine M, Roberts L, Smith O. Science. 2002;295:995. - PubMed
    1. Craelius W. Science. 2002;295:1018–21. - PubMed
    1. Green DW. Biomed Mater. 2008;3:034010. - PubMed
    1. Tian B, Liu J, Dvir T, Jin L, Tsui JH, Qing Q, Suo Z, Langer R, Kohane DS, Lieber CM. Nat Mater. 2012;11:986–94. - PMC - PubMed
    1. Timko BP, Cohen-Karni T, Yu G, Qing Q, Tian B, Lieber CM. Nano Lett. 2009;9:914–8. - PMC - PubMed

Publication types