

Functional understanding of solvent structure in GroEL cavity through dipole field analysis
- PMID: 23635172
- PMCID: PMC3651261
- DOI: 10.1063/1.4801942
Functional understanding of solvent structure in GroEL cavity through dipole field analysis
Abstract
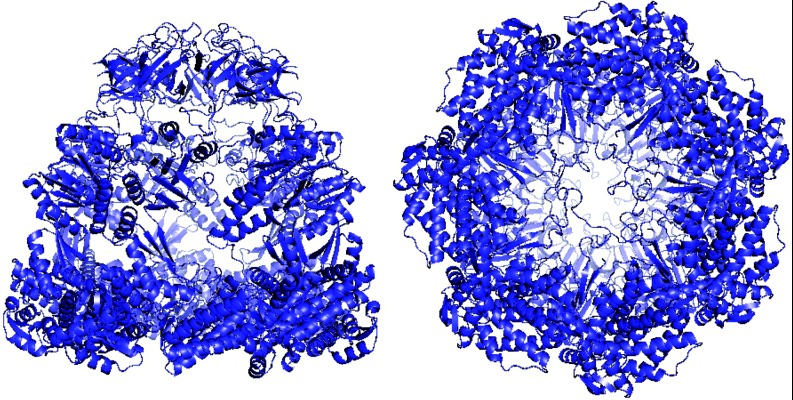
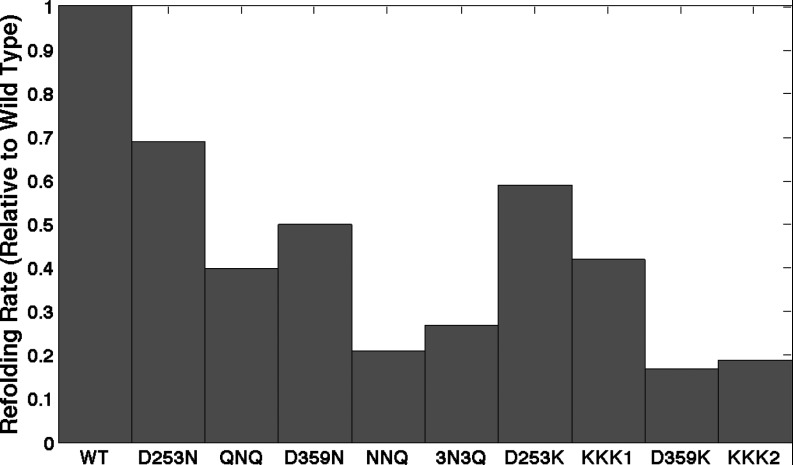
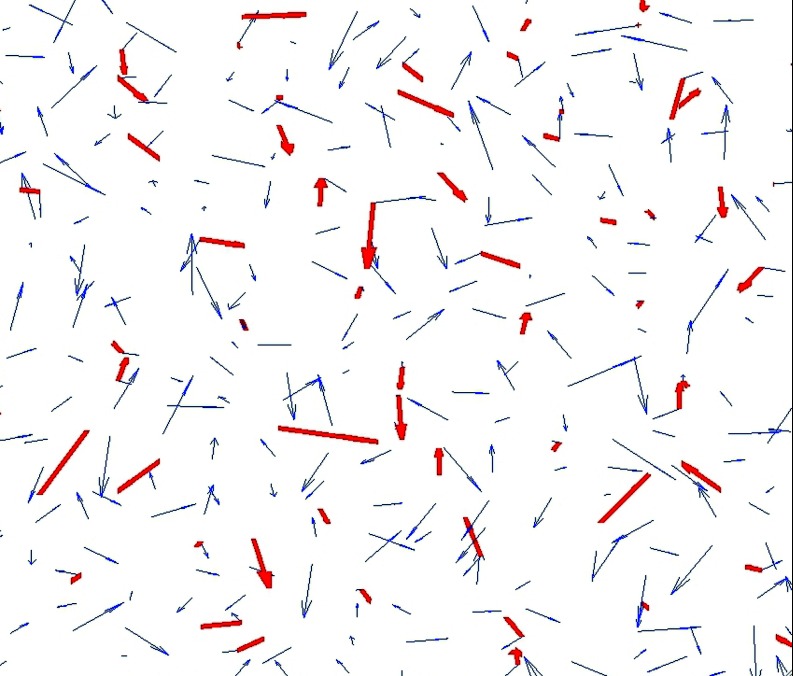
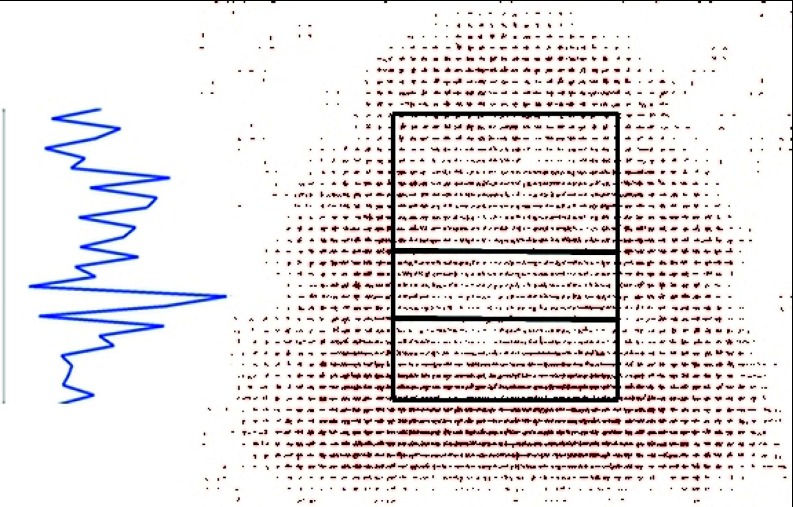
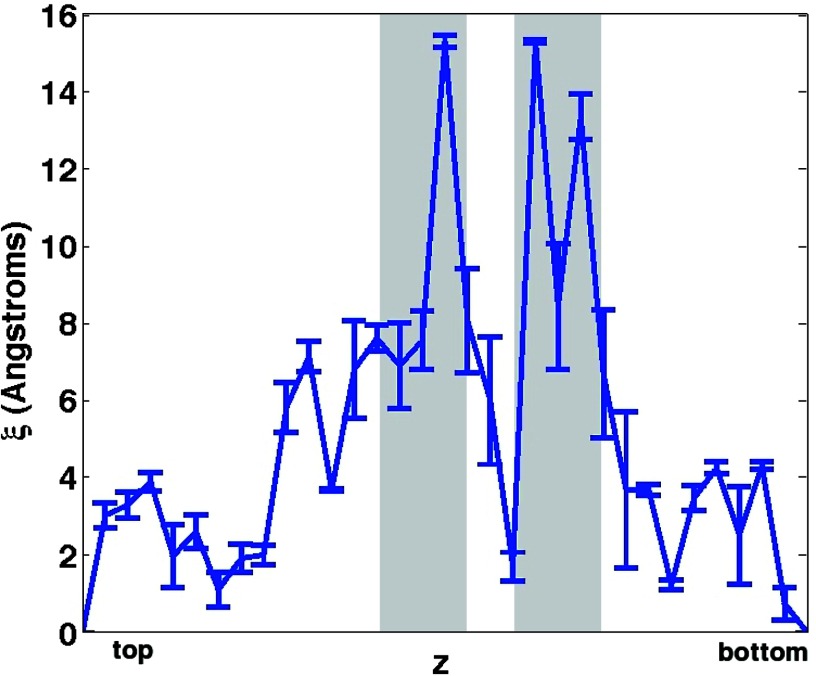
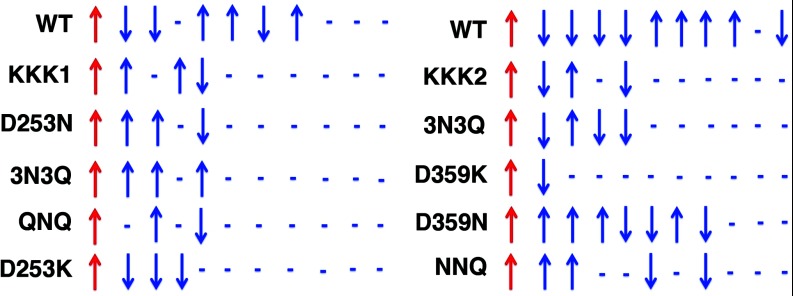
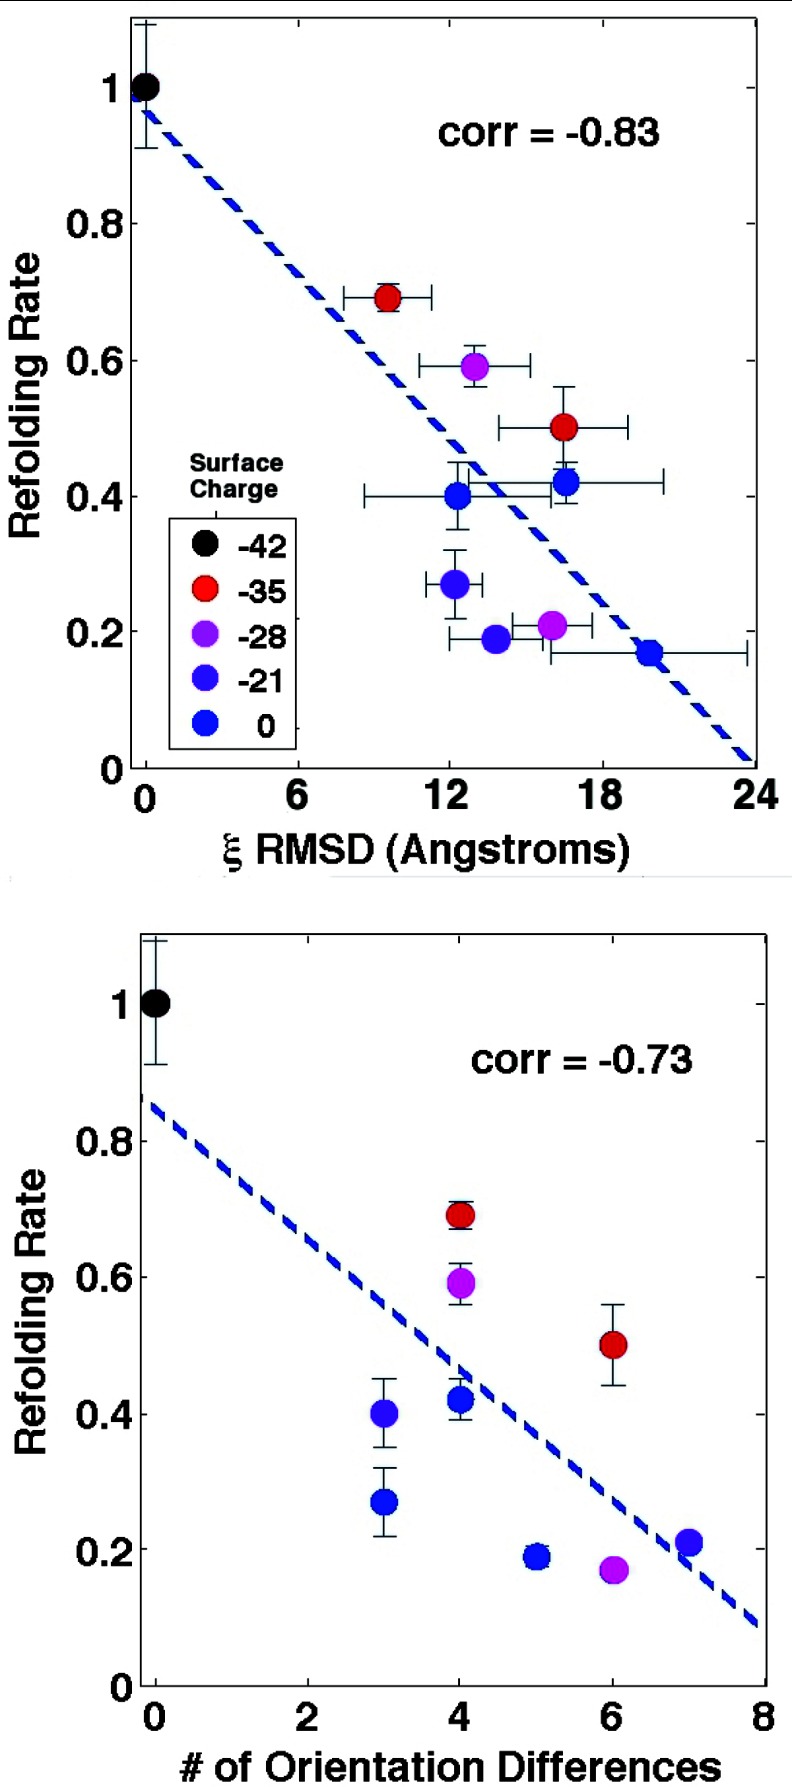
Solvent plays a ubiquitous role in all biophysical phenomena. Yet, just how the molecular nature of water impacts processes in biology remains an important question. While one can simulate the behavior of water near biomolecules such as proteins, it is challenging to gauge the potential structural role solvent plays in mediating both kinetic and equilibrium processes. Here, we propose an analysis scheme for understanding the nature of solvent structure at a local level. We first calculate coarse-grained dipole vector fields for an explicitly solvated system simulated through molecular dynamics. We then analyze correlations between these vector fields to characterize water structure under biologically relevant conditions. In applying our method to the interior of the wild type chaperonin complex GroEL+ES, along with nine additional mutant GroEL complexes, we find that dipole field correlations are strongly related to chaperonin function.
Figures
Similar articles
-
Visualizing GroEL/ES in the act of encapsulating a folding protein.Cell. 2013 Jun 6;153(6):1354-65. doi: 10.1016/j.cell.2013.04.052. Cell. 2013. PMID: 23746846 Free PMC article.
-
Local energetic frustration affects the dependence of green fluorescent protein folding on the chaperonin GroEL.J Biol Chem. 2017 Dec 15;292(50):20583-20591. doi: 10.1074/jbc.M117.808576. Epub 2017 Oct 24. J Biol Chem. 2017. PMID: 29066625 Free PMC article.
-
Efficient Catalysis of Protein Folding by GroEL/ES of the Obligate Chaperonin Substrate MetF.J Mol Biol. 2020 Mar 27;432(7):2304-2318. doi: 10.1016/j.jmb.2020.02.031. Epub 2020 Mar 2. J Mol Biol. 2020. PMID: 32135190
-
GroEL assisted folding of large polypeptide substrates in Escherichia coli: Present scenario and assignments for the future.Prog Biophys Mol Biol. 2009 Jan;99(1):42-50. doi: 10.1016/j.pbiomolbio.2008.10.007. Epub 2008 Nov 7. Prog Biophys Mol Biol. 2009. PMID: 19027782 Review.
-
Molecular chaperone GroEL/ES: unfolding and refolding processes.Biochemistry (Mosc). 2013 Dec;78(13):1405-14. doi: 10.1134/S0006297913130038. Biochemistry (Mosc). 2013. PMID: 24490731 Review.
Cited by
-
Single-molecule nanopore enzymology.Philos Trans R Soc Lond B Biol Sci. 2017 Aug 5;372(1726):20160230. doi: 10.1098/rstb.2016.0230. Philos Trans R Soc Lond B Biol Sci. 2017. PMID: 28630164 Free PMC article. Review.
-
The dynamic conformational cycle of the group I chaperonin C-termini revealed via molecular dynamics simulation.PLoS One. 2015 Mar 30;10(3):e0117724. doi: 10.1371/journal.pone.0117724. eCollection 2015. PLoS One. 2015. PMID: 25822285 Free PMC article.
-
Methodologies for the analysis of instantaneous lipid diffusion in MD simulations of large membrane systems.Faraday Discuss. 2014;169:455-75. doi: 10.1039/c3fd00145h. Epub 2014 Jun 17. Faraday Discuss. 2014. PMID: 25341001 Free PMC article.
-
Exploring Novel Antibiotics by Targeting the GroEL/GroES Chaperonin System.ACS Pharmacol Transl Sci. 2024 Dec 11;8(1):10-20. doi: 10.1021/acsptsci.4c00397. eCollection 2025 Jan 10. ACS Pharmacol Transl Sci. 2024. PMID: 39816798 Review.
References
Publication types
MeSH terms
Substances
Grants and funding
LinkOut - more resources
Full Text Sources
Other Literature Sources
Research Materials