. 2013 May;40(5):051711.
doi: 10.1118/1.4801899.

Effectiveness of robust optimization in intensity-modulated proton therapy planning for head and neck cancers

Affiliations

Effectiveness of robust optimization in intensity-modulated proton therapy planning for head and neck cancers

Wei Liu et al. Med Phys. 2013 May.

Abstract

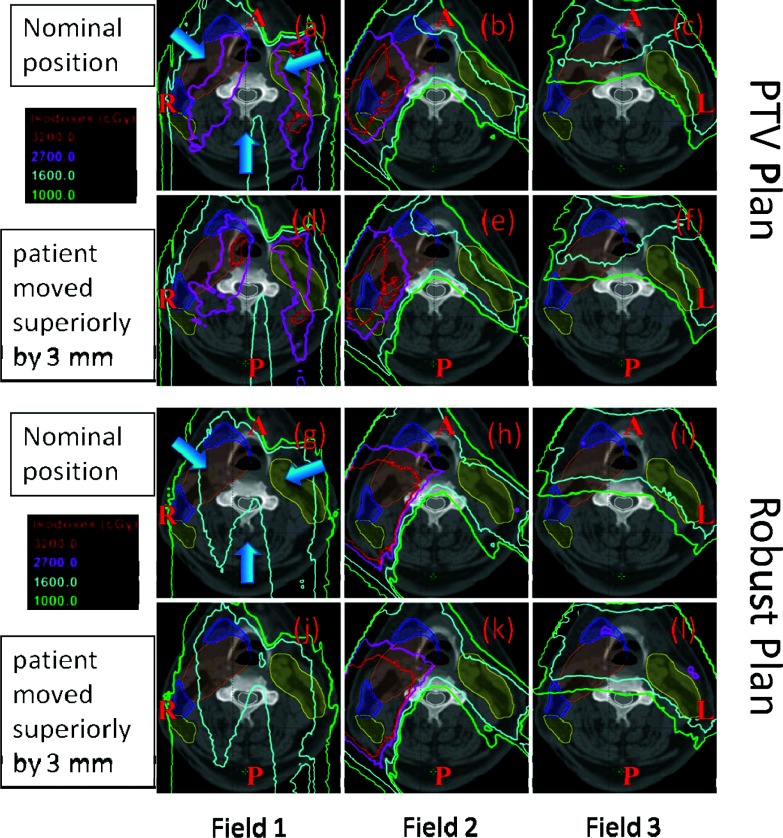
Purpose: Intensity-modulated proton therapy (IMPT) is highly sensitive to uncertainties in beam range and patient setup. Conventionally, these uncertainties are dealt using geometrically expanded planning target volume (PTV). In this paper, the authors evaluated a robust optimization method that deals with the uncertainties directly during the spot weight optimization to ensure clinical target volume (CTV) coverage without using PTV. The authors compared the two methods for a population of head and neck (H&N) cancer patients.

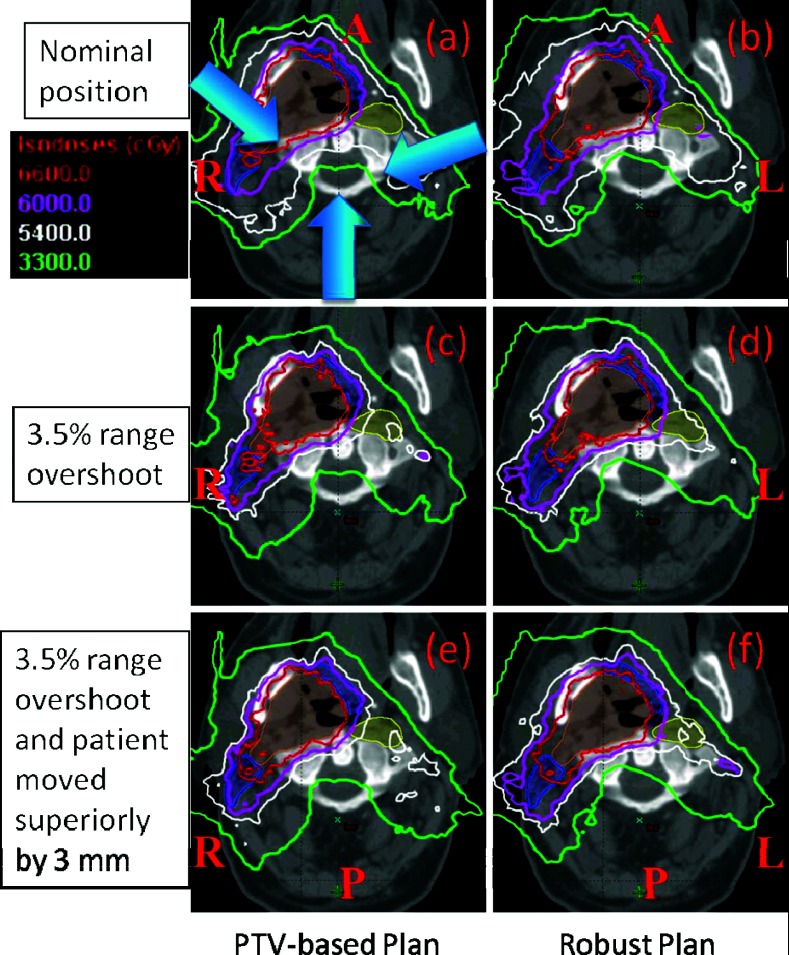
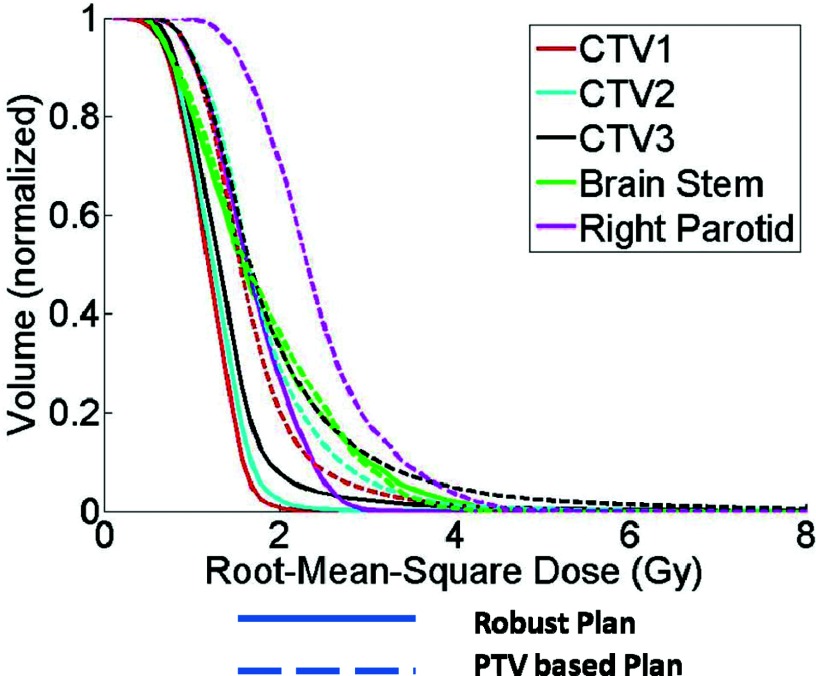
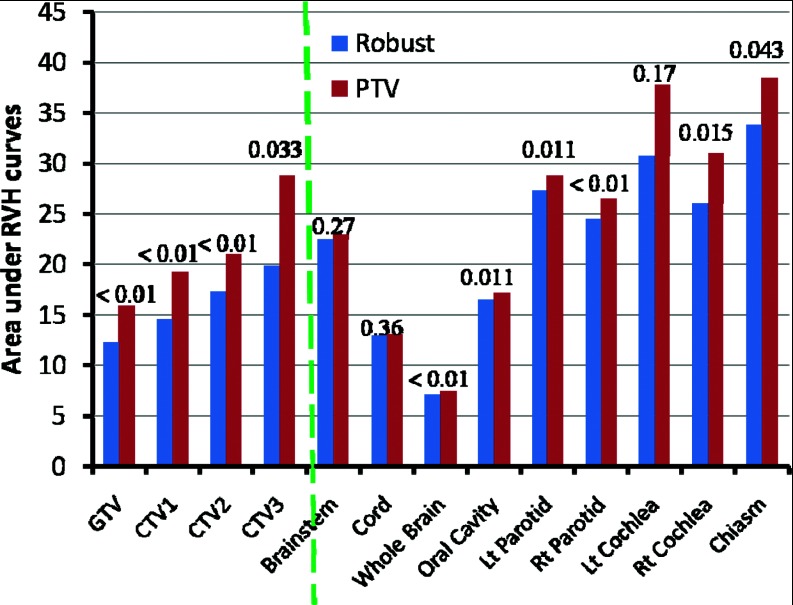
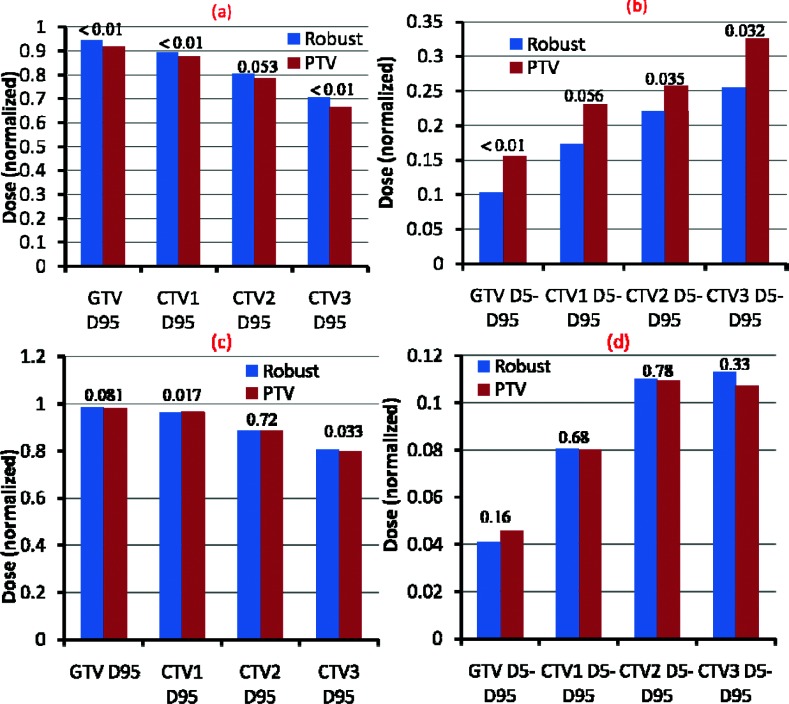
Methods: Two sets of IMPT plans were generated for 14 H&N cases, one being PTV-based conventionally optimized and the other CTV-based robustly optimized. For the PTV-based conventionally optimized plans, the uncertainties are accounted for by expanding CTV to PTV via margins and delivering the prescribed dose to PTV. For the CTV-based robustly optimized plans, spot weight optimization was guided to reduce the discrepancy in doses under extreme setup and range uncertainties directly, while delivering the prescribed dose to CTV rather than PTV. For each of these plans, the authors calculated dose distributions under various uncertainty settings. The root-mean-square dose (RMSD) for each voxel was computed and the area under the RMSD-volume histogram curves (AUC) was used to relatively compare plan robustness. Data derived from the dose volume histogram in the worst-case and nominal doses were used to evaluate the plan optimality. Then the plan evaluation metrics were averaged over the 14 cases and were compared with two-sided paired t tests.

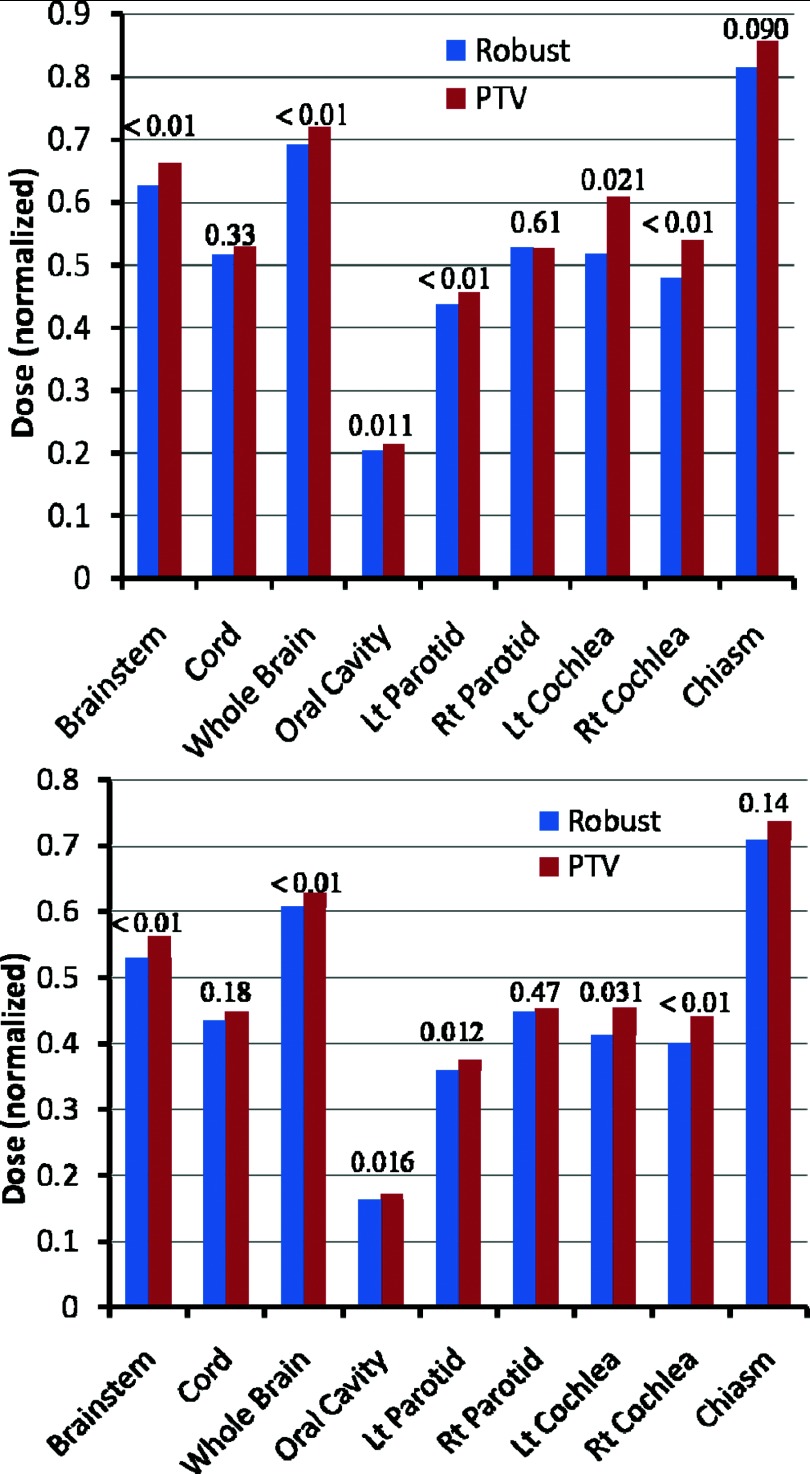
Results: CTV-based robust optimization led to more robust (i.e., smaller AUCs) plans for both targets and organs. Under the worst-case scenario and the nominal scenario, CTV-based robustly optimized plans showed better target coverage (i.e., greater D95%), improved dose homogeneity (i.e., smaller D5% - D95%), and lower or equivalent dose to organs at risk.

Conclusions: CTV-based robust optimization provided significantly more robust dose distributions to targets and organs than PTV-based conventional optimization in H&N using IMPT. Eliminating the use of PTV and planning directly based on CTV provided better or equivalent normal tissue sparing.


Figures

Figure 1
Figure 1
Dose distributions in the transverse plane for a representative patient illustrate the insensitivity of the robustly optimized plan (right panels) to range and set up uncertainties compared with the conventional PTV-based optimized plan (left panels). Top panels (a) and (b) show dose distributions in nominal position; whereas the middle panels (c) and (d) show corresponding data with 3.5% larger range and the bottom panels (e) and (f) are for 3.5% larger range and 3 mm superior shift. CTV1: left top big filled area; CTV2: two left small filled area abutting CTV1; CTV3: right small filled area disconnected from CTV1. Isodose lines in the PTV-based plan are perturbed to a significantly greater degree than in robustly optimized plan. For instance, CTV1 is not adequately covered with the prescribed dose of 66 Gy(RBE) in panel (c) and CTV3 is not covered with 54 Gy(RBE) in panels (c) and (e).
Figure 2
Figure 2
RVHs derived from a robustly optimized plan (solid lines) and from a PTV-based optimized plan (dashed lines) for patient 10. All curves are normalized to the total volume of the corresponding organs. Areas under the RVH curves of the robustly optimized plan are smaller than those of the PTV-based optimized plan. The solid lines are for CTV1, CTV2, CTV3, Brain Stem, and Right Parotid, respectively from left to right.
Figure 3
Figure 3
Areas under the RVH curves for various structures (averaged over 14 H&N cancer cases) derived from the robustly optimized plans (left bar for each structure) and the PTV-based optimized plans (right bar for each structure) indicate the improved robustness of the robustly optimized plans. Data for targets (GTV; CTV) are to the left of the dashed line, and data for normal tissues are to the right. Numbers at the top of the columns are P values.
Figure 4
Figure 4
(a) and (b) D95% doses and D5% averaged over 14 H&N cases illustrate the improved target coverage and superior dose homogeneity of the robust optimization process (left bar for each structure) to the PTV-based optimization (right bar for each structure) in the worst-case scenario. (c) and (d) D95% doses and D5% averaged over 14 H&N cases illustrate the comparable target coverage and similar dose homogeneity of the robust optimization process (left bar for each structure) to the PTV-based optimization (right bar for each structure) in the nominal scenario. Numbers at the top of the columns are P values. The values of each case are normalized to the corresponding prescription doses before averaging [see Table I of the supplementary material (Ref. 27)].
Figure 5
Figure 5
Sparing of OARs in the worst-case scenario (top) and in the nominal scenario (bottom) in the robustly optimized plans (left bar for each structure) and the PTV-based plans (right bar for each structure), averaged over 14 H&N cases. Doses shown are D1cm3 to the spinal cord and brainstem, Dmean to the oral cavity and parotids, and D1% for other organs. Numbers at the top of the columns are P values. Data indicate improved sparing with robust optimization. The values of each case are normalized to the corresponding prescription doses before averaging [see Table I of the supplementary material (Ref. 27)].
Figure 6
Figure 6
Dose distributions per field in the transverse plane for a representative patient illustrate the relative insensitivity of the robustly optimized plan (g)–(l) to setup uncertainties compared with the conventional PTV-based optimized plan (a)–(f). Panels (a)–(c) and (g)–(i) show dose distributions in nominal position; whereas the panels (d)–(f) and (j)–(l) show corresponding data with 3 mm superior shift. CTV1: left top big filled area; CTV2: two left small filled area abutting CTV1; CTV3: right filled area disconnected from CTV1. The shift perturbs the dose distribution in the PTV-based plan significantly [e.g., 32 and 27 Gy(RBE) isodose lines]. Field 1 appears to be most sensitive to perturbation presumably because it passes through most complex inhomogeneities. Robust optimization automatically reduces the contribution from this field. Furthermore, robust optimization considerably reduces high dose gradients within each of the three fields.

Similar articles

Cited by

References

    1. Widesott L., Pierelli A., Fiorino C., Dell’Oca I., Broggi S., Catraneo G. M., Di Muzio N., Fazio F., Calandrino R., and Schwarz M., “Intensity-modulated proton therapy versus helical tomotherapy in nasopharynx cancer: Planning comparison and NTCP evaluation,” Int. J. Radiat. Oncol., Biol., Phys. 72, 589–596 (2008).10.1016/j.ijrobp.2008.05.065 - DOI - PubMed
    1. Steneker M., Lomax A., and Schneider U., “Intensity modulated photon and proton therapy for the treatment of head and neck tumors,” Radiother. Oncol. 80, 263–267 (2006).10.1016/j.radonc.2006.07.025 - DOI - PubMed
    1. Lomax A. J., “Intensity modulated proton therapy and its sensitivity to treatment uncertainties. 1: The potential effects of calculational uncertainties,” Phys. Med. Biol. 53, 1027–1042 (2008).10.1088/0031-9155/53/4/014 - DOI - PubMed
    1. Lomax A. J., “Intensity modulated proton therapy and its sensitivity to treatment uncertainties. 2: The potential effects of inter-fraction and inter-field motions,” Phys. Med. Biol. 53, 1043–1056 (2008).10.1088/0031-9155/53/4/015 - DOI - PubMed
    1. Lomax A. J., Pedroni E., Rutz H., and Goitein G., “The clinical potential of intensity modulated proton therapy,” Z. Med. Phys. 14, 147–152 (2004). - PubMed

Publication types

MeSH terms