

Genome-wide search for the genes accountable for the induced resistance to HIV-1 infection in activated CD4+ T cells: apparent transcriptional signatures, co-expression networks and possible cellular processes
- PMID: 23635305
- PMCID: PMC3655860
- DOI: 10.1186/1755-8794-6-15
Genome-wide search for the genes accountable for the induced resistance to HIV-1 infection in activated CD4+ T cells: apparent transcriptional signatures, co-expression networks and possible cellular processes
Abstract
Background: Upon co-stimulation with CD3/CD28 antibodies, activated CD4 + T cells were found to lose their susceptibility to HIV-1 infection, exhibiting an induced resistant phenotype. This rather unexpected phenomenon has been repeatedly confirmed but the underlying cell and molecular mechanisms are still unknown.
Methods: We first replicated the reported system using the specified Dynal beads with PHA/IL-2-stimulated and un-stimulated cells as controls. Genome-wide expression and analysis were then performed by using Agilent whole genome microarrays and established bioinformatics tools.
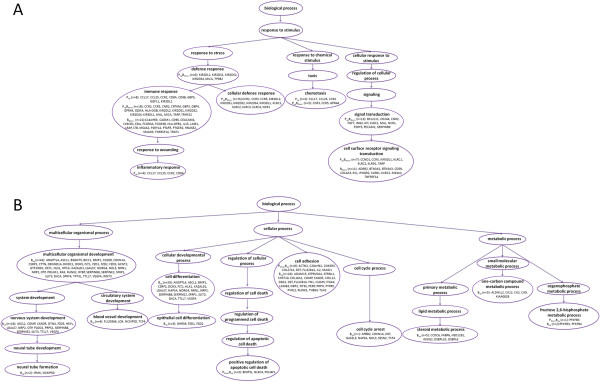
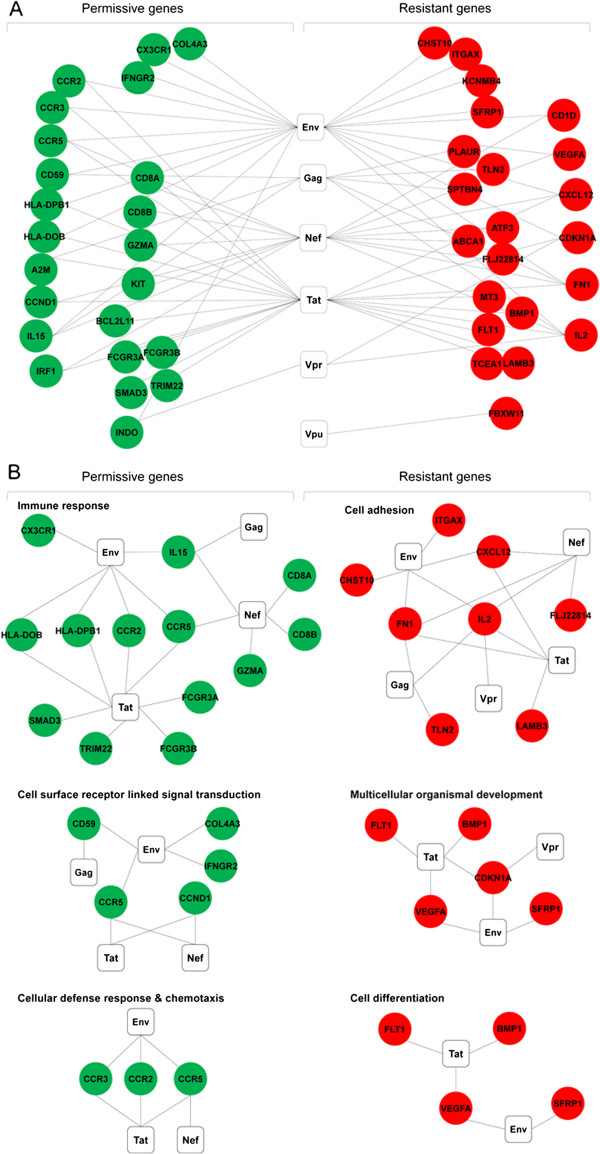
Results: We showed that following CD3/CD28 co-stimulation, a homogeneous population emerged with uniform expression of activation markers CD25 and CD69 as well as a memory marker CD45RO at high levels. These cells differentially expressed 7,824 genes when compared with the controls on microarrays. Series-Cluster analysis identified 6 distinct expression profiles containing 1,345 genes as the representative signatures in the permissive and resistant cells. Of them, 245 (101 potentially permissive and 144 potentially resistant) were significant in gene ontology categories related to immune response, cell adhesion and metabolism. Co-expression networks analysis identified 137 "key regulatory" genes (84 potentially permissive and 53 potentially resistant), holding hub positions in the gene interactions. By mapping these genes on KEGG pathways, the predominance of actin cytoskeleton functions, proteasomes, and cell cycle arrest in induced resistance emerged. We also revealed an entire set of previously unreported novel genes for further mining and functional validation.
Conclusions: This initial microarray study will stimulate renewed interest in exploring this system and open new avenues for research into HIV-1 susceptibility and its reversal in target cells, serving as a foundation for the development of novel therapeutic and clinical treatments.
Figures


Similar articles
-
A dichotomy in cortical actin and chemotactic actin activity between human memory and naive T cells contributes to their differential susceptibility to HIV-1 infection.J Biol Chem. 2012 Oct 12;287(42):35455-35469. doi: 10.1074/jbc.M112.362400. Epub 2012 Aug 9. J Biol Chem. 2012. PMID: 22879601 Free PMC article. Clinical Trial.
-
Toll-Like Receptor 2 Ligation Enhances HIV-1 Replication in Activated CCR6+ CD4+ T Cells by Increasing Virus Entry and Establishing a More Permissive Environment to Infection.J Virol. 2017 Jan 31;91(4):e01402-16. doi: 10.1128/JVI.01402-16. Print 2017 Feb 15. J Virol. 2017. PMID: 27928019 Free PMC article.
-
Engagement of CD28 modulates CXC chemokine receptor 4 surface expression in both resting and CD3-stimulated CD4+ T cells.J Immunol. 2000 Apr 15;164(8):4018-24. doi: 10.4049/jimmunol.164.8.4018. J Immunol. 2000. PMID: 10754293
-
Optimization of ex vivo activation and expansion of macaque primary CD4-enriched peripheral blood mononuclear cells for use in anti-HIV immunotherapy and gene therapy strategies.J Acquir Immune Defic Syndr. 2003 Mar 1;32(3):245-54. doi: 10.1097/00126334-200303010-00002. J Acquir Immune Defic Syndr. 2003. PMID: 12626883
-
[Deep lung--cellular reaction to HIV].Rev Port Pneumol. 2007 Mar-Apr;13(2):175-212. Rev Port Pneumol. 2007. PMID: 17492233 Review. Portuguese.
Cited by
-
Identification of differentially expressed genes through RNA sequencing in goats (Capra hircus) at different postnatal stages.PLoS One. 2017 Aug 11;12(8):e0182602. doi: 10.1371/journal.pone.0182602. eCollection 2017. PLoS One. 2017. PMID: 28800357 Free PMC article.
-
RNA interference approaches for treatment of HIV-1 infection.Genome Med. 2015 May 28;7(1):50. doi: 10.1186/s13073-015-0174-y. eCollection 2015. Genome Med. 2015. PMID: 26019725 Free PMC article.
-
Network-Based Analysis of OMICs Data to Understand the HIV-Host Interaction.Front Microbiol. 2020 Jun 17;11:1314. doi: 10.3389/fmicb.2020.01314. eCollection 2020. Front Microbiol. 2020. PMID: 32625189 Free PMC article. Review.
-
Omic Technologies in HIV: Searching Transcriptional Signatures Involved in Long-Term Non-Progressor and HIV Controller Phenotypes.Front Immunol. 2022 Jul 1;13:926499. doi: 10.3389/fimmu.2022.926499. eCollection 2022. Front Immunol. 2022. PMID: 35844607 Free PMC article. Review.
-
Cell adhesion function was altered during the seasonal regression of the seminiferous epithelium in the mink species Neovison vison.J Anim Sci. 2023 Jan 3;101:skad190. doi: 10.1093/jas/skad190. J Anim Sci. 2023. PMID: 37282598 Free PMC article.
References
Publication types
MeSH terms
Substances
LinkOut - more resources
Full Text Sources
Other Literature Sources
Medical
Molecular Biology Databases
Research Materials
