. 2013 Sep 15;22(18):2532-42.
doi: 10.1089/scd.2012.0623. Epub 2013 Jun 8.

Ddx46 is required for multi-lineage differentiation of hematopoietic stem cells in zebrafish

Affiliations

Ddx46 is required for multi-lineage differentiation of hematopoietic stem cells in zebrafish

Ryo Hirabayashi et al. Stem Cells Dev. .

Abstract

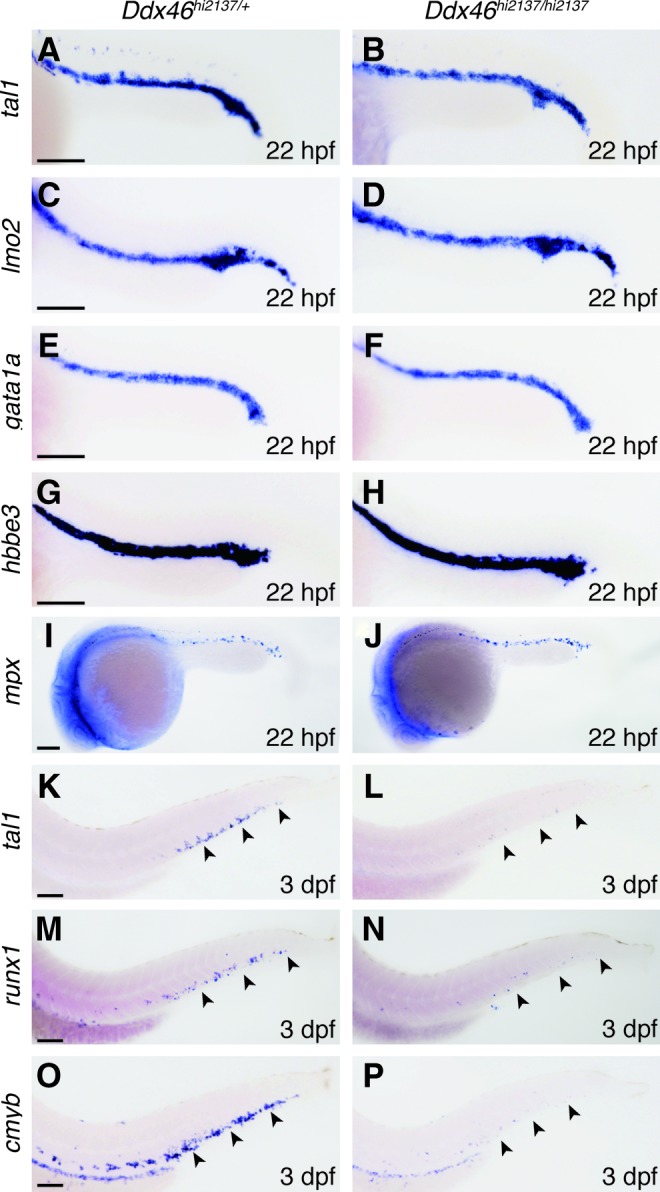
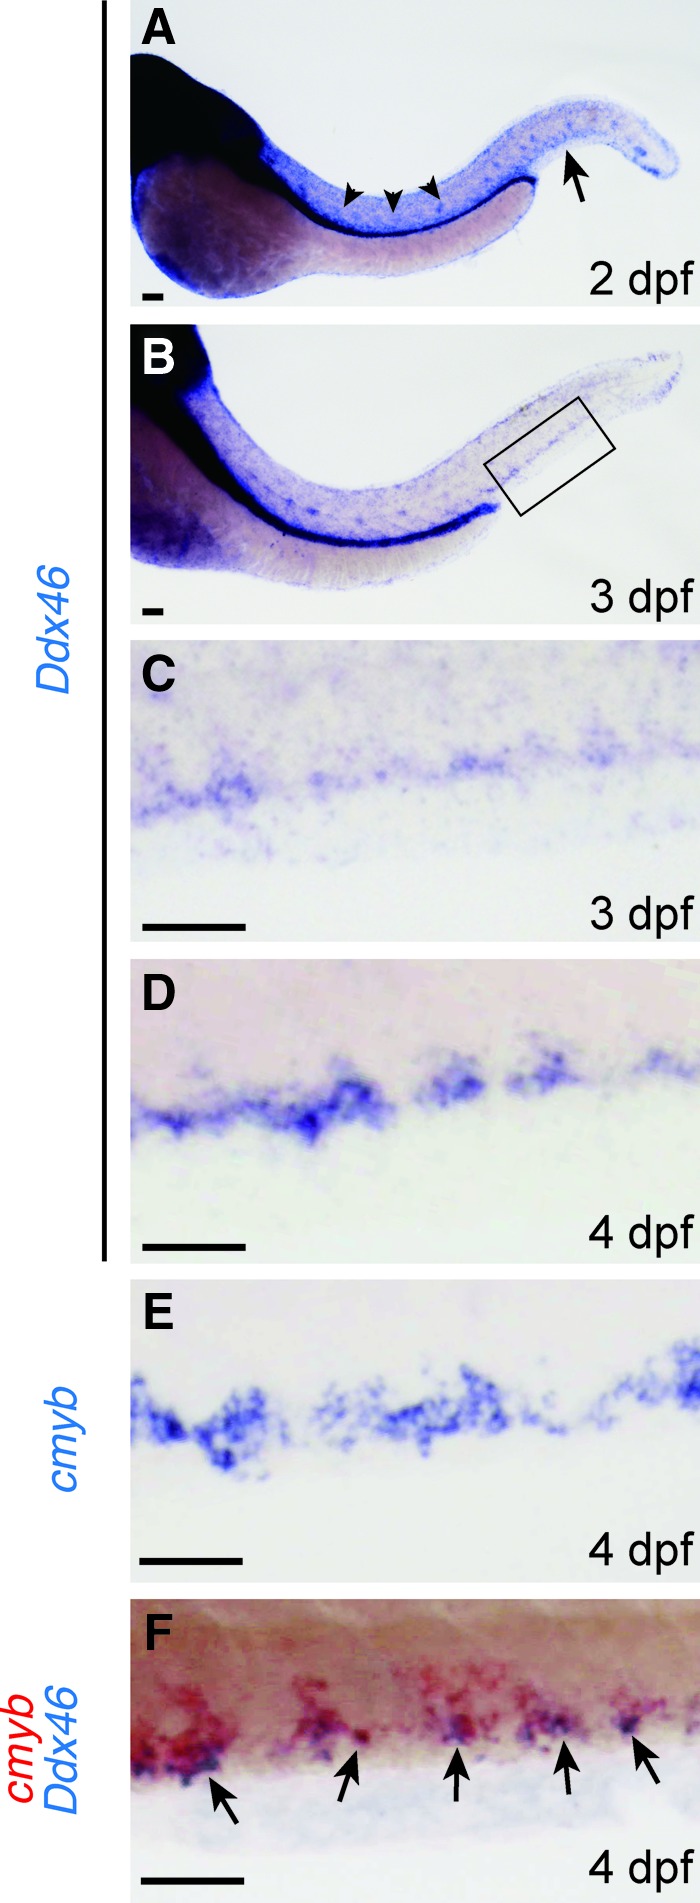
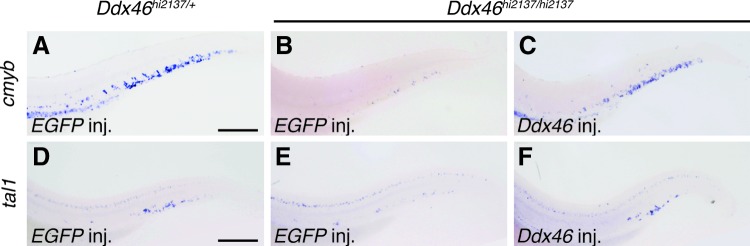
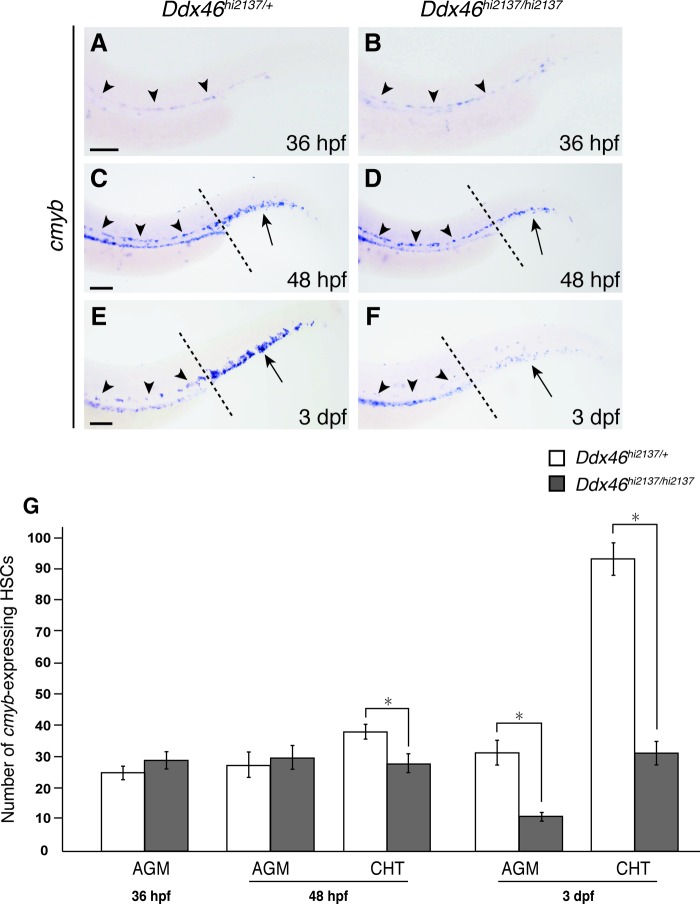
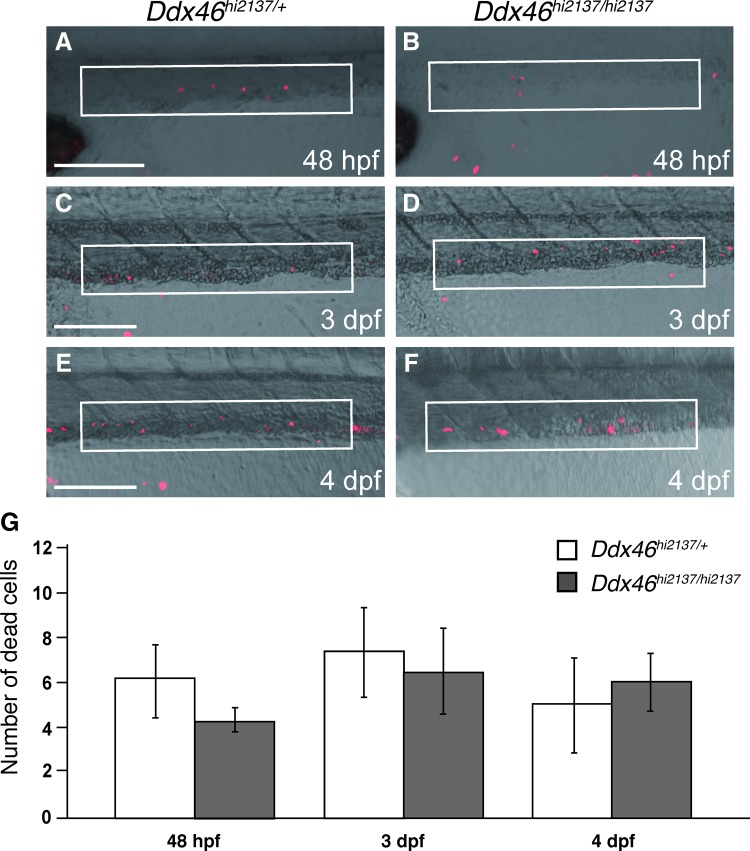
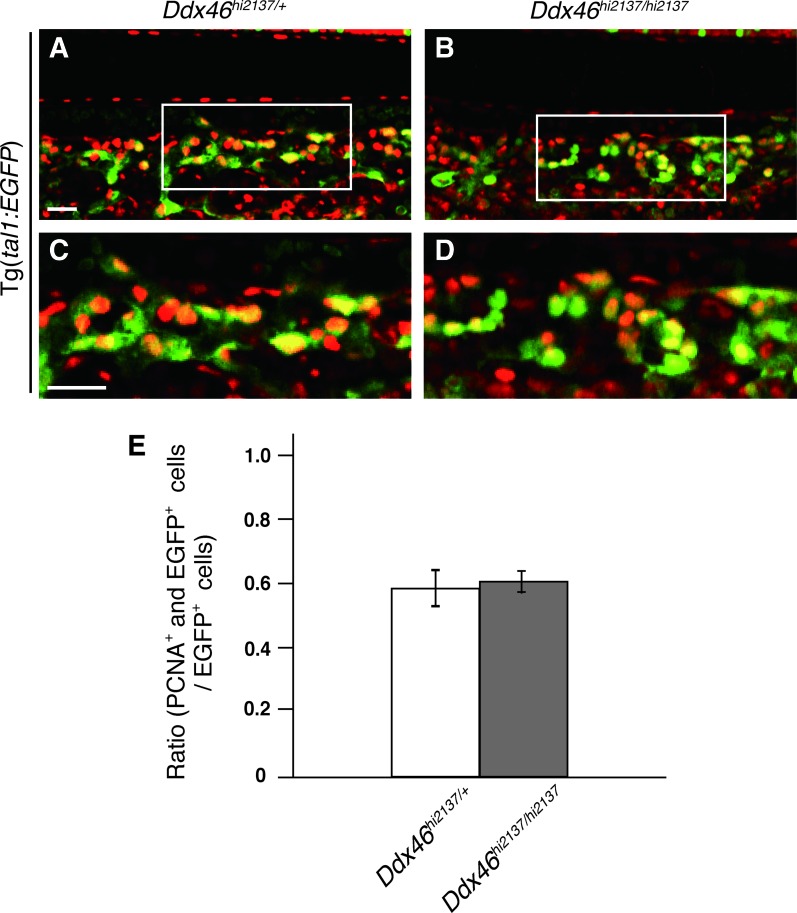
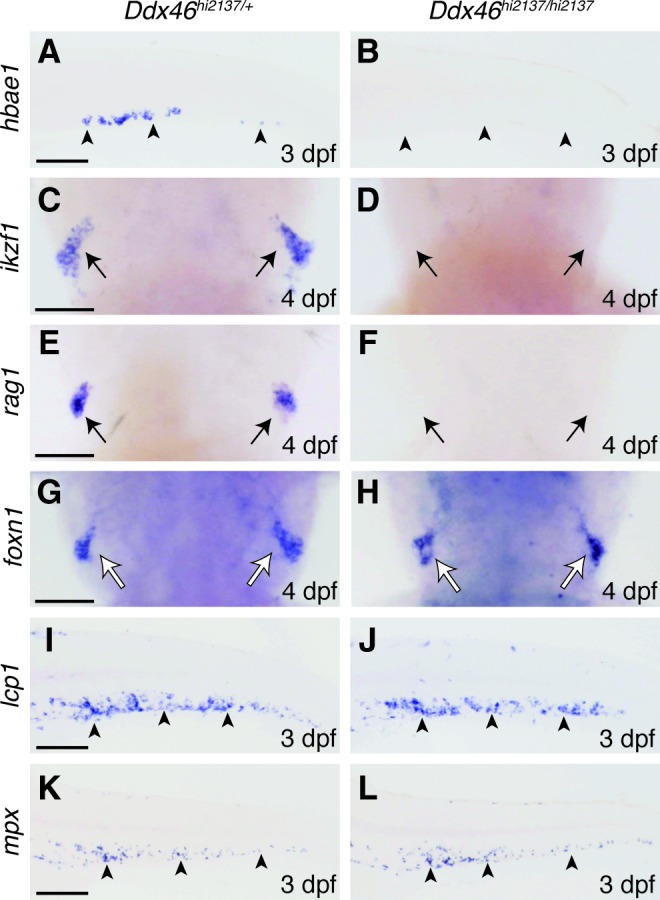
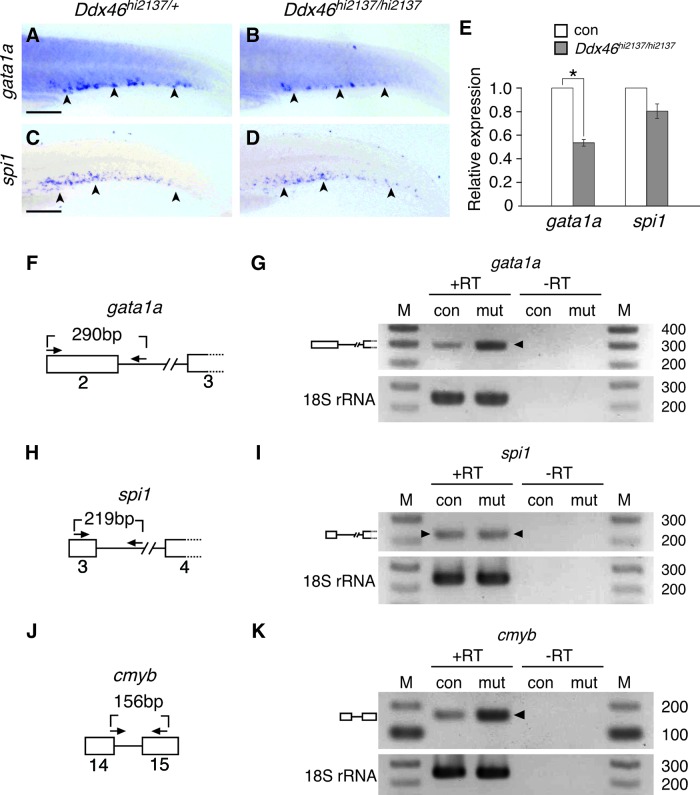
Balanced and precisely controlled processes between self-renewal and differentiation of hematopoietic stem cells (HSCs) into all blood lineages are critical for vertebrate definitive hematopoiesis. However, the molecular mechanisms underlying the maintenance and differentiation of HSCs have not been fully elucidated. Here, we show that zebrafish Ddx46, encoding a DEAD-box RNA helicase, is expressed in HSCs of the caudal hematopoietic tissue (CHT). The number of HSCs expressing the molecular markers cmyb or T-cell acute lymphocytic leukemia 1 (tal1) was markedly reduced in Ddx46 mutants. However, massive cell death of HSCs was not detected, and proliferation of HSCs was normal in the CHT of the mutants at 48 h postfertilization. We found that myelopoiesis occurred, but erythropoiesis and lymphopoiesis were suppressed, in Ddx46 mutants. Consistent with these results, the expression of spi1, encoding a regulator of myeloid development, was maintained, but the expression of gata1a, encoding a regulator of erythrocyte development, was downregulated in the mutants. Taken together, our results provide the first genetic evidence that zebrafish Ddx46 is required for the multilineage differentiation of HSCs during development, through the regulation of specific gene expressions.


Figures

FIG. 1.
FIG. 1.
Definitive, but not primitive, hematopoiesis is defective in Ddx46hi2137/hi2137 mutants. (A–J) The expression of primitive hematopoietic markers, tal1, lmo2, gata1a, hbbe3, and mpx, and definitive hematopoietic markers, tal1, runx1, and cmyb was examined by whole-mount in situ hybridization at 22 hpf and 3 dpf, respectively. All are lateral views, anterior to the left. The expression of tal1, lmo2, gata1a, hbbe3, and mpx was indistinguishable between Ddx46hi2137/+ (tal1, n=9/9; lmo2, n=11/11; gata1a, n=9/9; hbbe3, n=12/12; mpx, n=16/16) and Ddx46hi2137/hi2137 embryos (tal1, n=9/9; lmo2, n=9/9; gata1a, n=7/7; hbbe3, n=10/10; mpx, n=7/7) at 22 hpf (A–J). In contrast, the number of cells expressing tal1, runx1, and cmyb in Ddx46hi2137/hi2137 larvae (tal1, n=6/6; runx1, n=9/9; cmyb, n=11/11) was markedly reduced compared with that in Ddx46hi2137/+ larvae (tal1, n=8/8; runx1, n=11/11; cmyb, n=13/13) at 3 dpf (arrowheads in K–P). Scale bars represent 100 μm. tal1, T-cell acute lymphocytic leukemia 1; hpf, hours postfertilization; lmo2, LIM domain only 2; hbbe3, hemoglobin beta embryonic-3; mpx, myeloid-specific peroxidase; dpf, days postfertilization. Color images available online at www.liebertpub.com/scd
FIG. 2.
FIG. 2.
Ddx46 expression in HSCs. The expression of Ddx46 and cmyb in wild-type larvae was examined by whole-mount in situ hybridization at 2, 3, and 4 dpf. All are lateral views, anterior to the left. (A-C) Ddx46 is ubiquitously expressed in the AGM (arrowheads in A) and CHT (arrow in A) at 2 dpf (n=6/6) and is specifically expressed in the CHT (boxed area in B) at 3 dpf (n=6/6). The boxed area in (B) is shown enlarged in (C). (D, E) The transcripts of both genes (Ddx46, n=11/11; cmyb, n=9/9) were detected in the CHT at 4 dpf. (F) Double whole-mount in situ staining showed that the expression domains of Ddx46 (blue) and cmyb (red) overlapped in the CHT (arrows) (n=7/7) at 4 dpf. Scale bars represent 50 μm. HSCs, hematopoietic stem cells; AGM, aorta-gonad-mesonephros; CHT, caudal hematopoietic tissue. Color images available online at www.liebertpub.com/scd
FIG. 3.
FIG. 3.
Expression of cmyb and tal1 in Ddx46hi2137/hi2137 mutants is rescued by overexpression of Ddx46 mRNA. (A–F) The expression of cmyb and tal1 was examined by whole-mount in situ hybridization at 3 dpf. All are lateral views, anterior to the left. The number of cmyb- or tal1-expressing HSCs in the EGFP mRNA-injected Ddx46hi2137/hi2137 larvae (cmyb, 0 of 26 EGFP mRNA-injected mutants were rescued; tal1, 0 of 21 EGFP mRNA-injected mutants were rescued) was markedly lower than that in the EGFP mRNA-injected Ddx46hi2137/+ larvae (cmyb, n=17/17; tal1, n=16/16) at 3 dpf (A, B, D, E). The overexpression of Ddx46 mRNA was able to rescue the number of cmyb- or tal1-expressing HSCs in Ddx46hi2137/hi2137 larvae (cmyb, 19 of 21 Ddx46 mRNA-injected mutants were rescued; tal1, 19 of 22 Ddx46 mRNA-injected mutants were rescued) at 3 dpf (B, C, E, F). Scale bars represent 100 μm. Color images available online at www.liebertpub.com/scd
FIG. 4.
FIG. 4.
Number of cmyb-expressing cells decreases in Ddx46hi2137/hi2137 mutants. (A–G) The expression of cmyb was examined by whole-mount in situ hybridization at 36 hpf, 48 hpf, or 3 dpf. All are lateral views, anterior to the left. The number of cmyb-expressing HSCs in the AGM (arrowheads) and CHT (arrows) was counted at 36 hpf, 48 hpf, and 3 dpf (G). At 36 hpf, the number of cmyb-expressing HSCs in the AGM (arrowheads) was indistinguishable between Ddx46hi2137/+ and Ddx46hi2137/hi2137 larvae (A, B, G). In contrast, the number of cmyb-expressing HSCs in the CHT (arrows), but not in the AGM (arrowheads), at 48 hpf (C, D, G) and in both the AGM (arrowheads) and CHT (arrows) at 3 dpf (E, F, G) of Ddx46hi2137/hi2137 larvae was significantly reduced compared with that of Ddx46hi2137/+ larvae. Ddx46hi2137/+ larvae: n=13/13 (36 hpf), n=18/18 (48 hpf), n=13/13 (3 dpf); Ddx46hi2137/hi2137 larvae: n=9/9 (36 hpf), n=14/14 (48 hpf), n=11/11 (3 dpf). Black dotted lines in (C–F) indicate the boundary between the AGM and CHT. Error bars represent the standard error. *P<0.01 by the Student's t-test. Scale bars represent 100 μm. Color images available online at www.liebertpub.com/scd
FIG. 5.
FIG. 5.
Cell death is not upregulated in the CHT of Ddx46hi2137/hi2137 mutants. (A–F) Confocal microscopic images of dead cells (red) detected by the TUNEL method at 48 hpf, 3 dpf, or 4 dpf. All are lateral views, anterior to the left. The white, boxed regions show an area of the CHT. (G) The number of labeled cells in the white, boxed regions (A–F) was counted. The number of dead cells in the CHT was indistinguishable between Ddx46hi2137/+ and Ddx46hi2137/hi2137 larvae at 48 hpf, 3 dpf, and 4 dpf. Ddx46hi2137/+ larvae: n=7/7 (48 hpf), n=5/5 (3 dpf), n=5/5 (4 dpf); Ddx46hi2137/hi2137 larvae: n=5/5 (48 hpf), n=6/6 (3 dpf), n=8/8 (4 dpf). Error bars represent the standard error. Scale bars represent 75 μm. Color images available online at www.liebertpub.com/scd
FIG. 6.
FIG. 6.
Cell proliferation is not downregulated in the CHT of Ddx46hi2137/hi2137 mutants at 48 hpf. (A–D) Confocal microscopic images of EGFP fluorescence (green) and anti-PCNA (red) whole-mount immunostaining of the CHT in Ddx46hi2137/+;Tg(tal1:EGFP) and Ddx46hi2137/hi2137;Tg(tal1:EGFP) larvae at 48 hpf. All are lateral views, anterior to the left. Merged single-slice images of cells expressing EGFP (HSCs) and PCNA (proliferating cells). The boxed areas in (A) and (B) are shown enlarged in (C) and (D), respectively. (E) Quantification of the experiments in panels (C) and (D) was performed by plotting the ratio of EGFP+ and PCNA+ cells (yellow) to the total number of EGFP+ cells (green and yellow). No significant difference between Ddx46hi2137/+;Tg(tal1:EGFP) and Ddx46hi2137/hi2137;Tg(tal1:EGFP) larvae was observed. Cells were counted from four single slices from four embryos for each condition. Error bars represent the standard error. The scale bar represents 20 μm. PCNA, proliferating cell nuclear antigen. Color images available online at www.liebertpub.com/scd
FIG. 7.
FIG. 7.
Myelopoiesis occurs, but erythropoiesis and lymphopoiesis are suppressed in Ddx46hi2137/hi2137 mutants. (A–L) The expression of molecular markers for erythrocytes, lymphocytes, myelocytes, and a thymus epithelium was examined by whole-mount in situ hybridization at 3 and 4 dpf. Lateral views, anterior to the left (A, B, I–L). Dorsal views, anterior to the top (C–H). The expression of a definitive erythroid marker hbae1 was markedly reduced in Ddx46hi2137/hi2137 larvae at 3 dpf (arrowheads in A, B) (Ddx46hi2137/hi2137 larvae, n=7/7; Ddx46hi2137/+ larvae, n=9/9). The expression of lymphoid markers, ikzf1 (Ddx46hi2137/hi2137 larvae, n=9/9; Ddx46hi2137/+ larvae, n=9/9) and rag1 (Ddx46hi2137/hi2137 larvae, n=9/9; Ddx46hi2137/+ larvae, n=7/7), was lost in Ddx46hi2137/hi2137 larvae (black arrows in C–F), whereas the expression of a thymus epithelial marker foxn1 was indistinguishable between Ddx46hi2137/+ (n=7/7) and Ddx46hi2137/hi2137 larvae (n=9/9) at 4 dpf (white arrows in G, H). In contrast, the expression of myeloid markers, lcp1 (Ddx46hi2137/hi2137 larvae, n=8/8; Ddx46hi2137/+ larvae, n=8/8) and mpx (Ddx46hi2137/hi2137 larvae, n=12/13; Ddx46hi2137/+ larvae, n=8/8), was maintained in Ddx46hi2137/hi2137 larvae at 3 dpf (arrowheads in I–L). Scale bars represent 100 μm. hbae1, hemoglobin alpha embryonic-1; ikzf1, IKAROS family zinc finger 1; rag1, recombination activating gene 1; foxn1, forkhead box N1; lcp1, lymphocyte cytosolic plastin 1. Color images available online at www.liebertpub.com/scd
FIG. 8.
FIG. 8.
Expression and pre-mRNA splicing of gata1a, but not spi1, are defective in Ddx46hi2137/hi2137 mutants. (A–D) The expression of gata1a and spi1 was examined by whole-mount in situ hybridization at 3 dpf. All are lateral views, anterior to the left. The expression of gata1a in the CHT of Ddx46hi2137/hi2137 larvae (n=10/10) was markedly reduced compared with that of Ddx46hi2137/+ larvae (n=10/10) (arrowheads in A, B). In contrast, spi1 expression in the CHT of Ddx46hi2137/hi2137 larvae (n=10/10) was maintained compared with that of Ddx46hi2137/+ larvae (n=9/9) (arrowheads in C, D). Scale bars represent 100 μm. (E) Relative expression of gata1a and spi1 genes in control (con) larvae compared with that in Ddx46hi2137/hi2137 larvae at 3 dpf, by qPCR. Although no significant difference of spi1 expression was found between con and Ddx46hi2137/hi2137 larvae, gata1a expression in Ddx46hi2137/hi2137 larvae was significantly lower than that in con larvae. *P<0.01 by the Student's t-test. Error bars represent the standard error. (F–K) Schematic drawings of the gata1a, spi1, and cmyb pre-mRNA regions analyzed for splicing (boxes, exons; lines, introns; arrows, primers) (F, H, J). The splicing status of gata1a, spi1, or cmyb pre-mRNA was monitored by RT-PCR with the primers indicated in schemes (F), (H), or (J), respectively. The reverse primer for gata1a or spi1 mRNA was designed within the intron (F, H). The forward primer for cmyb crosses the exon14/intron14 boundary (J). Unspliced gata1a or cmyb mRNA was retained at a higher level in Ddx46hi2137/hi2137 mutant (mut) larvae than in con larvae (arrowhead in G=290 bp; arrowhead in K=156 bp). In contrast, the level of unspliced spi1 mRNA was indistinguishable between the mut larvae and con larvae (arrowheads in I=219 bp). Unspliced PCR products were verified by sequencing.+RT refers to the validation reaction itself, and −RT represents the respective control reaction without reverse transcriptase. 18S rRNA is a loading control. Control larvae were sibling WT or Ddx46hi2137/+ larvae, and they had normal phenotypes. qPCR, quantitative polymerase chain reaction; RT, reverse transcription. Color images available online at www.liebertpub.com/scd

Similar articles

Cited by

References

    1. Cumano A. Godin I. Ontogeny of the hematopoietic system. Annu Rev Immunol. 2007;25:745–785. - PubMed
    1. Orkin SH. Zon LI. Hematopoiesis: an evolving paradigm for stem cell biology. Cell. 2008;132:631–644. - PMC - PubMed
    1. Medvinsky A. Rybtsov S. Taoudi S. Embryonic origin of the adult hematopoietic system: advances and questions. Development. 2011;138:1017–1031. - PubMed
    1. Carradice D. Lieschke GJ. Zebrafish in hematology: sushi or science? Blood. 2008;111:3331–3342. - PMC - PubMed
    1. Paik EJ. Zon LI. Hematopoietic development in the zebrafish. Int J Dev Biol. 2010;54:1127–1137. - PubMed

Publication types

MeSH terms

Substances

LinkOut - more resources