. 2013 May 1:11:107.
doi: 10.1186/1479-5876-11-107.

Evaluating glymphatic pathway function utilizing clinically relevant intrathecal infusion of CSF tracer

Evaluating glymphatic pathway function utilizing clinically relevant intrathecal infusion of CSF tracer

Lijun Yang et al. J Transl Med. .

Abstract

Background: Neurodegenerative diseases such as Alzheimer's are associated with the aggregation of endogenous peptides and proteins that contribute to neuronal dysfunction and loss. The glymphatic system, a brain-wide perivascular pathway along which cerebrospinal fluid (CSF) and interstitial fluid (ISF) rapidly exchange, has recently been identified as a key contributor to the clearance of interstitial solutes from the brain, including amyloid β. These findings suggest that measuring changes in glymphatic pathway function may be an important prognostic for evaluating neurodegenerative disease susceptibility or progression. However, no clinically acceptable approach to evaluate glymphatic pathway function in humans has yet been developed.

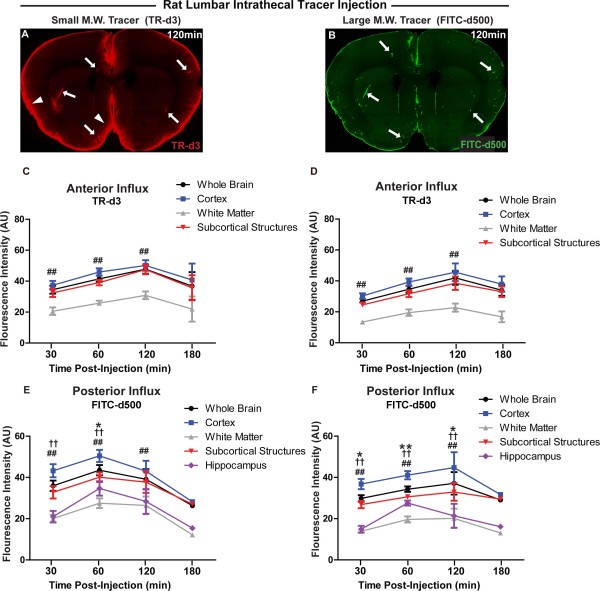
Methods: Time-sequenced ex vivo fluorescence imaging of coronal rat and mouse brain slices was performed at 30-180 min following intrathecal infusion of CSF tracer (Texas Red- dextran-3, MW 3 kD; FITC- dextran-500, MW 500 kD) into the cisterna magna or lumbar spine. Tracer influx into different brain regions (cortex, white matter, subcortical structures, and hippocampus) in rat was quantified to map the movement of CSF tracer following infusion along both routes, and to determine whether glymphatic pathway function could be evaluated after lumbar intrathecal infusion.

Results: Following lumbar intrathecal infusions, small molecular weight TR-d3 entered the brain along perivascular pathways and exchanged broadly with the brain ISF, consistent with the initial characterization of the glymphatic pathway in mice. Large molecular weight FITC-d500 remained confined to the perivascular spaces. Lumbar intrathecal infusions exhibited a reduced and delayed peak parenchymal fluorescence intensity compared to intracisternal infusions.

Conclusion: Lumbar intrathecal contrast delivery is a clinically useful approach that could be used in conjunction with dynamic contrast enhanced MRI nuclear imaging to assess glymphatic pathway function in humans.


Figures

Figure 1
Figure 1
Defining the effect of intrathecal tracer infusion on intracranial pressure (ICP). Ventricular ICP was monitored continuously during infusion of CSF tracer Texas Red-conjugated dextran (TR-d3, MW 3 kD) in rats. (A) Intracisternal TR-d3 infusion at 1.6 ul/min did not appreciatively alter ICP, whereas increasing the infusion rate to 3.2 and 6.4 ul/min significantly elevated ICP. (B) Intracisternal and lumbar infusion of TR-d3 did at 1.6 μl/min for 60min did not significantly alter ICP (n = 4 per group).
Figure 2
Figure 2
Evaluating intracisternal CSF tracer influx and clearance in mouse and rat. Representative anterior (A-B) and posterior (D-E) coronal slices from mouse (A, D) and rat (B, E) brains following intracisternal infusion of Texas Red-conjugated dextran (TR-d3, MW 3kD; t = 30min post-infusion) show similar tracer distributions between species. (C, F) Un-infused rat brain slices exhibit little tissue autofluorescence. (G-J) Tissue fluorescence was evaluated in different brain regions: cortex (blue), white matter (grey), hippocampus (magenta), and subcortical structures (red) of the anterior (G-H) and posterior (I-J) brain. (H, J) Quantification of mean fluorescence intensity within each region (*P < 0.05 cortex vs. subcortical structures; ##P < 0.01 cortex vs. white matter structures; 2-way ANOVA; n = 3–4 per time point). Dashed line indicates average gray matter tissue autofluorescence level.
Figure 3
Figure 3
Effect of molecular weight on tracer influx into the brain after lumbar intrathecal infusion. (A-B) Coronal brain slices show penetration of large molecular weight FITC-conjugated dextran (FITC-d500, MW 500kD) and small molecular weight Texas Red-conjugated dextran (TR-d3, MW 3kD) 120 min after lumbar intrathecal co-infusion. FITC-d500 is largely confined to perivascular spaces (B, arrows), while TR-d3 moves readily though the brain parenchyma from perivascular spaces (A, arrows) or from the pial surface (arrowheads). (C-F) Quantification of fluorescent tracer influx into anterior (C-D) and posterior (E-F) brain after lumbar intrathecal infusion, anatomically subdivided into cortex, white matter, subcortical structures, and hippocampus.(*P < 0.05, *P < 0.01 cortex vs. subcortical structures; ##P < 0.01 cortex vs. white matter; P < 0.05, ††P < 0.01 cortex vs. hippocampus; 2-way ANOVA; n = 3-4 per time point).
Figure 4
Figure 4
CSF tracer localization after intracisternal and lumbar intrathecal infusion. (A-F) Localization of FITC-conjugated dextran (FITC-d500, MW 500kD) and Texas Red-conjugated dextran (TR-d3, MW 3 kD) 30 min after intracisternal infusion. Large molecular weight FITC-d500 remained restricted to perivascular spaces (arrows) surrounding penetrating arteries (A-B) and extending to the level of the terminal capillary beds (C-F, arrows). Small molecular weight TR-d3 moved quickly into the brain interstitium and was taken up by subpopulations of neurons (arrowheads). (G-L) 120 min after lumbar intrathecal infusion of tracers, large molecular weight FITC-d500 accumulated in perivascular spaces (arrows), but not as uniformly as observed after intracisternal infusion. Small molecular weight TR-d3 moved readily throughout the brain parenchyma. Inset (L) depicts IB4 staining and background green and red fluorescence in tissue from animals not injected with CSF tracer. GFAP: glial fibrillary acidic protein (astrocytic marker); IB4: isolectin B4 (vascular endothelial marker).

References

    1. Jucker M, Walker LC. Pathogenic protein seeding in Alzheimer disease and other neurodegenerative disorders. Ann Neurol. 2011;70:532–540. doi: 10.1002/ana.22615. - DOI - PMC - PubMed
    1. Hardy J, Selkoe DJ. The amyloid hypothesis of Alzheimer’s disease: progress and problems on the road to therapeutics. Science. 2002;297:353–356. doi: 10.1126/science.1072994. - DOI - PubMed
    1. Small SA, Duff K. Linking Abeta and tau in late-onset Alzheimer’s disease: a dual pathway hypothesis. Neuron. 2008;60:534–542. doi: 10.1016/j.neuron.2008.11.007. - DOI - PMC - PubMed
    1. Maccioni RB, Farias G, Morales I, Navarrete L. The revitalized tau hypothesis on Alzheimer’s disease. Arch Med Res. 2010;41:226–231. doi: 10.1016/j.arcmed.2010.03.007. - DOI - PubMed
    1. Bruijn LI, Houseweart MK, Kato S, Anderson KL, Anderson SD, Ohama E, Reaume AG, Scott RW, Cleveland DW. Aggregation and motor neuron toxicity of an ALS-linked SOD1 mutant independent from wild-type SOD1. Science. 1998;281:1851–1854. - PubMed

Publication types

Substances