. 2013 May 1;10(84):20130179.
doi: 10.1098/rsif.2013.0179. Print 2013 Jul 6.

Mesenchymal stem cell mechanobiology and emerging experimental platforms

Affiliations

Mesenchymal stem cell mechanobiology and emerging experimental platforms

Luke MacQueen et al. J R Soc Interface. .

Abstract

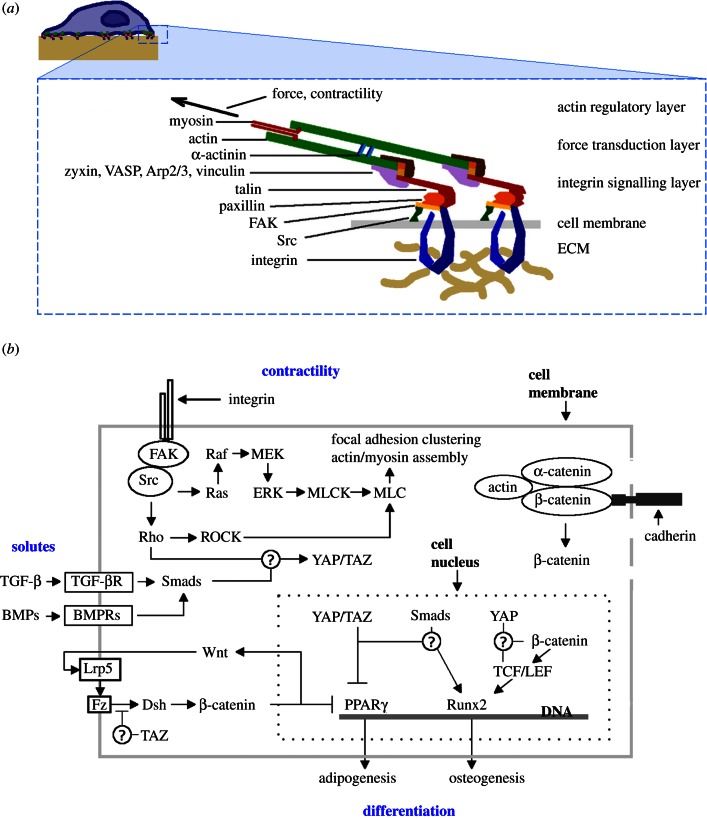
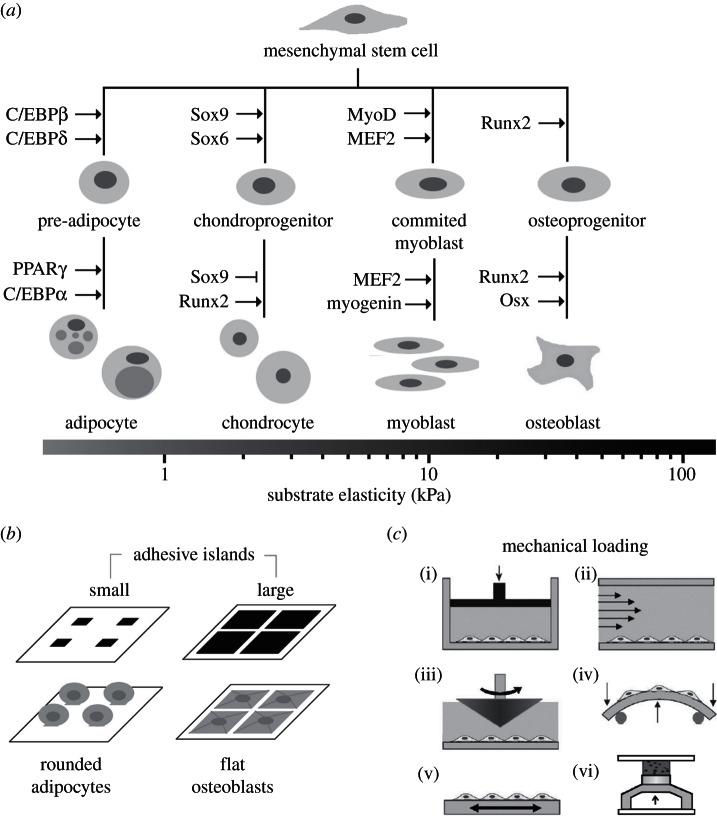
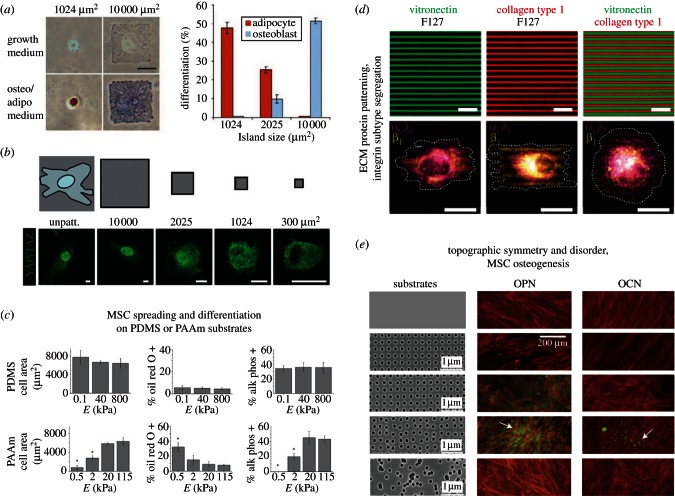
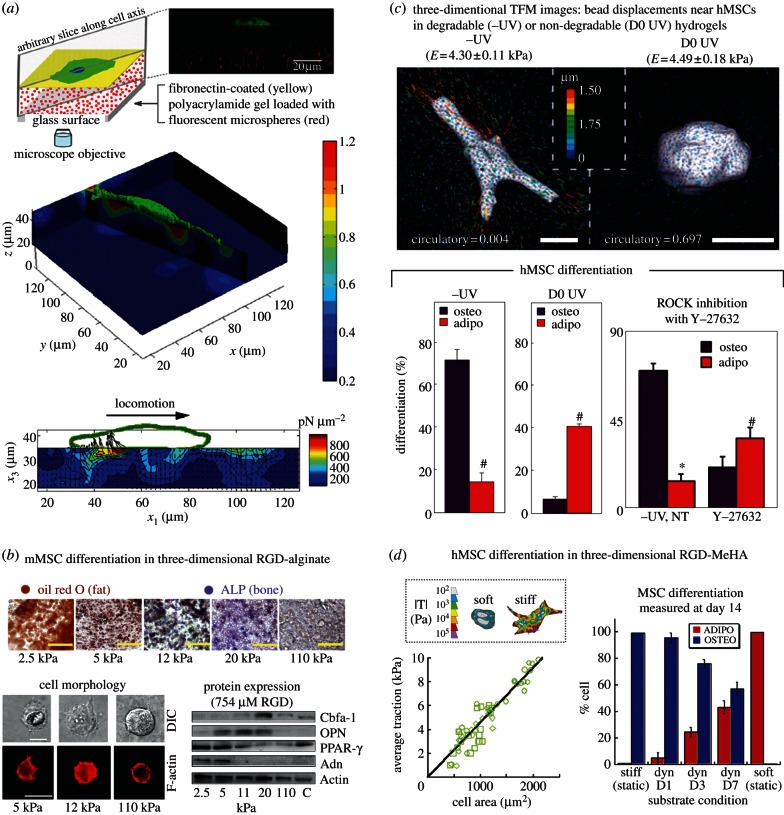
Experimental control over progenitor cell lineage specification can be achieved by modulating properties of the cell's microenvironment. These include physical properties of the cell adhesion substrate, such as rigidity, topography and deformation owing to dynamic mechanical forces. Multipotent mesenchymal stem cells (MSCs) generate contractile forces to sense and remodel their extracellular microenvironments and thereby obtain information that directs broad aspects of MSC function, including lineage specification. Various physical factors are important regulators of MSC function, but improved understanding of MSC mechanobiology requires novel experimental platforms. Engineers are bridging this gap by developing tools to control mechanical factors with improved precision and throughput, thereby enabling biological investigation of mechanics-driven MSC function. In this review, we introduce MSC mechanobiology and review emerging cell culture platforms that enable new insights into mechanobiological control of MSCs. Our main goals are to provide engineers and microtechnology developers with an up-to-date description of MSC mechanobiology that is relevant to the design of experimental platforms and to introduce biologists to these emerging platforms.

Keywords: high-throughput screening; mechanobiology; mesenchymal stem cell; microfluidics; microtechnology; niche.


Figures

Figure 1.
Figure 1.
Schematic of the integrin focal adhesion complex and contractile signalling. (a) Molecules that link the extracellular matrix (ECM) with the cell's internal cytoskeleton, adapted from [24] with permission from Elsevier and [25] with permission from MacMillan Publishers Ltd (Copyright 2010); (b) a simplified model of signalling pathways that are implicated in contractility-based mechanosensing and MSC differentiation, after [26] and [27]. TGF-β, transforming growth factor β; TGF-βR, transforming growth factor β receptor; BMP, bone morphogenetic protein; BMPR, bone morphogenetic protein receptor; Smad, small mothers against decapentaplegic proteins; FAK, focal adhesion kinase; Src, Rous sarcoma oncogene cellular homolog; Rho, Rho guanine nucleotide exchange factors; ROCK, Rho-associated kinase; Ras, Ras small GTPases; Raf, Raf serine/threonine-protein kinase; MEK, MAPK/Erk kinase; MAPK/ERK, mitogen-activated protein kinases/extracellular signal-regulated kinases; MLCK, myosin light-chain kinase; MLC, myosin light chain; Lrp5, low-density lipoprotein receptor-related protein 5; Fz, frizzled G protein-coupled receptor protein; Dsh, dishevelled protein; YAP, Yes-associated protein; TAZ, transcriptional coactivator with PDZ-binding motif; Runx2, Runt-related transcription factor 2; PPARγ, peroxisome proliferator-activated receptor γ.
Figure 2.
Figure 2.
Substrate mechanics and dynamic mechanical loading regulate mesenchymal stem cell (MSC) fate. (a) Transcriptional regulation of well-characterized MSC lineages and associated substrate elasticity values that enhance MSC lineage specification. MSC differentiation towards particular lineages is enhanced by substrates with elasticity that are similar to native tissues, adapted from [5] with permission from AAAS and [67] with permission from Cold Spring Harbor Laboratory Press; (b) adhesive ligand patterning regulates MSC shape and lineage specification. Differing cell–substrate contact areas are controlled by patterned islands of adhesive proteins to control cell shape, cytoskeletal tension, and differentiation; (c) methods used to apply dynamic mechanical forces to cell and tissue cultures: (i) hydrostatic pressure, (ii, iii) flow-induced shear stress, (iv) bending, (v) tension and (vi) compression, adapted from [68] with permission from the Royal Society of Chemistry.
Figure 3.
Figure 3.
Substrate patterning for mechanobiology. (a) Cell shape drives hMSC commitment. Left: bright-field images of hMSCs plated onto small (1024 μm2) or large (10 000 μm2) fibronectin islands after one week in growth or mixed medium. Lipids in adipocytes stain red; alkaline phosphatase in osteoblasts stains blue. Scale bar, 50 μm. Right: percentage differentiation of hMSCs plated onto 1024, 2025 or 10 000 μm2 islands after one week of culture in mixed medium, reproduced from [13] with permission from Elsevier; (b) YAP/TAZ localization is regulated by cell shape, top: grey patterns show the relative size of microprinted fibronectin islands on which cells were plated, and the outline of a cell is shown superimposed to the leftmost unpatterned area (unpatt.), bottom: confocal immunofluorescence images of MSCs plated on fibronectin islands of decreasing sizes (µm2), scale bars, 15 µm, reproduced from [82] with permission from MacMillan Publishers Ltd (Copyright 2011); (c) influence of substrate elasticity on spreading and differentiation of hMSCs. Quantification of cell spreading and differentiation after 24 h (F-actin) and 7 days (oil red O and alkaline phosphatase) in culture on PDMS and polyacrylamide (PAAm) covalently functionalized with collagen; substrate elastic modulus, E, is indicated; values are mean ± s.d.; *p < 0.05 when compared with 115 kPa gel, reproduced from [83] with permission from MacMillan Publishers Ltd (Copyright 2012); (d) micrographs of immunolabelled human umbilical vein endothelial cells (HUVECs) seeded on patterned substrates (top row) of vitronectin, collagen type I, and combined vitronectin/collagen type I, and showing integrin segregation (bottom row: ανβ5, purple; β1, yellow). Black areas are non-adhesive (F127 Pluronics). Scale bars, 20 µm, reproduced from [72] with permission from the Royal Society of Chemistry; (e) Osteopontin and osteocalcin (OPN/OCN, green) and actin (red) in MSCs after 21 days of culture on substrates with variously ordered nanotopographies, all have 120-nm-diameter pits (100 nm deep, absolute or average 300 nm centre–centre spacing) that are variously ordered. Increased OPN and OCN occurred when pit spacing was disordered (row 4, ± 50 nm from true centre) but not random; arrows indicate bone nodule formation reprinted from [84] with permission from MacMillan Publishers Ltd (Copyright 2007).
Figure 4.
Figure 4.
Mechanobiology in three dimensions. (a) Measurement of forces exerted by cells on (and in) compliant substrates during locomotion, top: Schematic of a representative gel sample with microscope objective fluorescent microspheres (red) and GFP-transfected cells (green), middle: displacement contour slices along the long axis of the cell, bottom: contour plots show the magnitude of the three-dimensional traction force vector for a single locomoting 3T3 fibroblast in pN µm˗2, top and middle panels are reprinted from Maskarinec et al. [102] (Copyright 2009, National Academy of Sciences, USA); bottom panel is reproduced from Franck et al. [103] with permission from the Public Library of Science; (b) matrix compliance alters MSC fate in three-dimensional matrix culture. Top: in situ staining of encapsulated clonally derived mMSCs (D1) for ALP activity (Fast Blue; osteogenic biomarker, blue) and neutral lipid accumulation (oil red O; adipogenic biomarker, red) after one week of culture in the presence of combined osteogenic and adipogenic chemical supplements within encapsulating matrices consisting of RGD-modified alginate. Bottom left: cross sections of mMSCs 2 h after encapsulation into three-dimensional alginate matrices with varying E and constant (754 μM) RGD density, visualized by differential–interference contrast (DIC) and F-actin staining (Alexa Fluor 568-phalloidin). Bottom right: Western analysis of osteogenic (Cbfa-1, OPN) and adipogenic (PPAR-γ, Adn) protein expression in mMSCs cultured in (754 uM) RGD-alginate hydrogels for one week, reproduced from [104] with permission from MacMillan Publishers Ltd (Copyright 2010); (c) hydrogel structure-dependent hMSC matrix interactions and fate choice. Top: representative three-dimensional traction force microscopy (TFM) images of hMSCs following 7 days growth-media incubation in hydrogels that were either proteolytically degradable (–UV) or photopolymerized to resist degradation (D0 UV). Bottom: hMSC differentiation following an additional 14 days mixed-medium incubation. Percentage differentiation of hMSCs towards osteogenic or adipogenic lineages in –UV (left) or D0 UV (middle; *p < 0 : 005, t-test). Bottom right: percentage differentiation fate of hMSCs towards osteogenic or adipogenic lineages within –UV gels following 7 days growth-media incubation with or without (no treatment, NT) daily 10 μM Y-27632, and a further 14 days mixed-medium incubation. Reproduced from [105] with permission from MacMillan Publishers Ltd (Copyright 2013); (d) temporal stiffening in situ regulates hMSC differentiation. Left: average cellular traction plotted against corresponding cell area over a 14 h period, immediately after in situ stiffening. Each dataset represents an individual cell (n = 3). Linear fit is plotted as solid line (slope = 0.046). Inset boxed area shows colour traction maps of representative hMSCs on stiff and soft hydrogels; the pseudocolour bar indicates the spatial traction forces, |T|, in Pascal. Scale bar, 25 µm. Right: mean percentages of hMSCs stained positive for ALP (osteo) and oil red O (adipo) as a function of stiffening time. Error bars indicate the s.d. (n = 3). Substrate condition is defined as static or dynamic (dyn), and for dynamic gels stiffening time (D1, D3, D7 for 1, 3 and 7 days, respectively, of culture in mixed media before stiffening) is reported, reproduced from [106] with permission from MacMillan Publishers Ltd (Copyright 2012).
Figure 5.
Figure 5.
Dynamic mechanical loading of cells, biomaterials, and tissues using deformable elastomeric membranes. (a) Schematized operation of bulging membranes to apply tensile or compressive strains. Pressure is supplied through an underlying channel layer to deform membranes, cylindrical loading posts that are attached to the membranes deform overlying cell culture films (tension) or compress biomaterial samples; (b) left: microfabricated device with a 5 × 5 array of mechanically active three-dimensional culture sites (green dye in the pressurized actuation channels). Increasing actuation cavity size across the array enables a range of mechanical conditions to be created simultaneously. Right: orthogonally resliced confocal image of fluorescent bead markers within a single hydrogel cylinder over a unit on the array at rest (top) and when actuated at 55 kPa (bottom), reproduced from [73] with permission from Elsevier; (c) multiple actuation heights are achieved on a single device using a single driving pressure by microfabricating multiple pressure cavity radii, reproduced from [133] with permission from IOP Publishing; (d) elastomeric strain sensors that are integrated within deformable membranes provide online readouts of membrane actuation height, reproduced from [134] with permission from the Royal Society of Chemistry.
Figure 6.
Figure 6.
‘Organ-on-a-chip’ platforms that recapitulate key aspects of in vivo niches. (a) A ‘lung-on-a-chip’ device that uses compartmentalized PDMS microchannels to form an alveolar–capillary barrier on a thin, porous, flexible PDMS membrane coated with ECM and recreates physiological breathing movements by applying vacuum to the side chambers that cause mechanical stretching of the PDMS membrane, reproduced from [75] with permission from AAAS; (b) a multi-layer microfluidic device for efficient culture and analysis of renal tubular cells, reproduced with from [139] with permission from the Royal Society of Chemistry; (c) schematic and photograph of a cardiomyocyte culture chip with microgrooves oriented either parallel or perpendicular to electrodes, reproduced from [140] with permission from the Royal Society of Chemistry; (d) ‘heart-on-a-chip’ for contractility assays with anisotropic layers of myocytes, scale bar, 20 µm, reproduced from [76] with permission from the Royal Society of Chemistry.
Figure 7.
Figure 7.
Clonogenic assays and single cell tracking. (a) Cell colonies in 96-well microplates stained with Crystal Violet after 21 days in culture (left), and heterogeneity in potency of mesenchymal stem cell clones from two donors (right), abbreviations: A, adipogenic phenotype; C, chondrogenic phenotype; O, osteogenic phenotype, reproduced [18] with permission from Wiley Publishing; (b) schematic of a microfluidic real-time gene expression array. Reporter cell lines for multiple genes and transcription factors are seeded in separate channels and stimulated with soluble stimuli in the orthogonal direction (coloured arrows), reproduced with from [146] with permission from the Royal Society of Chemistry; (c) schematic of hydrogel arrays with hundreds of microwells containing single muscle stem cells, followed by time-lapse microscopy, scale bar, 100 µm, reproduced from [147] with permission from AAAS; (d) trapping single cells in lineage chambers. Top left: average volumetric flow rates through the bypass and trapping channels are proportional to the length of arrows superimposed on the bright-field image, bottom left: bright-field image showing an array of trapping chambers filled with single cells that are identified by black dots, middle: time course of clonogenic expansion, right: dynamic lineage map of fluorescently tagged heat shock protein-12 (Hsp12-GFP) levels normalized to the mean fluorescence of the population, reproduced from Rowat et al. [148] (Copyright 2009, National Academy of Sciences, USA).

Similar articles

Cited by

References

    1. Moore KA, Lemischka IR. 2006. Stem cells and their niches. Science 311, 1880–188510.1126/science.1110542 (doi:10.1126/science.1110542) - DOI - DOI - PubMed
    1. Yin T, Li LH. 2006. The stem cell niches in bone. J. Clin. Invest. 116, 1195–120110.1172/Jci28568 (doi:10.1172/Jci28568) - DOI - DOI - PMC - PubMed
    1. Ehninger A, Trumpp A. 2011. The bone marrow stem cell niche grows up: mesenchymal stem cells and macrophages move in. J. Exp. Med. 208, 421–42810.1084/Jem.20110132 (doi:10.1084/Jem.20110132) - DOI - DOI - PMC - PubMed
    1. Cosgrove BD, Sacco A, Gilbert PM, Blau HM. 2009. A home away from home: challenges and opportunities in engineering in vitro muscle satellite cell niches. Differentiation 78, 185–19410.1016/j.diff.2009.08.004 (doi:10.1016/j.diff.2009.08.004) - DOI - DOI - PMC - PubMed
    1. Discher DE, Mooney DJ, Zandstra PW. 2009. Growth factors, matrices, and forces combine and control stem cells. Science 324, 1673–167710.1126/science.1171643 (doi:10.1126/science.1171643) - DOI - DOI - PMC - PubMed

MeSH terms