. 2013 May;12(5):787-98.
doi: 10.1158/1535-7163.MCT-12-1240. Epub 2013 May 1.

Impact of tumor vascularity on responsiveness to antiangiogenesis in a prostate cancer stem cell-derived tumor model

Affiliations

Impact of tumor vascularity on responsiveness to antiangiogenesis in a prostate cancer stem cell-derived tumor model

Kexiong Zhang et al. Mol Cancer Ther. 2013 May.

Abstract

Drugs that target the tumor vasculature and inhibit angiogenesis are widely used for cancer treatment. Individual tumors show large differences in vascularity, but it is uncertain how these differences affect responsiveness to antiangiogenesis. We investigated this question using two closely related prostate cancer models that differ markedly in tumor vascularity: PC3, which has very low vascularity, and the PC3-derived cancer stem-like cell holoclone PC3/2G7, which forms tumors with high microvessel density, high tumor blood flow, and low hypoxia compared with parental PC3 tumors. Three angiogenesis inhibitors (axitinib, sorafenib, and DC101) all induced significantly greater decreases in tumor blood flow and microvessel density in PC3/2G7 tumors compared with PC3 tumors, as well as significantly greater decreases in tumor cell proliferation and cell viability and a greater increase in apoptosis. The increased sensitivity of PC3/2G7 tumors to antiangiogenesis indicates they are less tolerant of low vascularity and suggests they become addicted to their oxygen- and nutrient-rich environment. PC3/2G7 tumors showed strong upregulation of the proangiogenic factors chemokine ligand 2 (CCL2) and VEGFA compared with PC3 tumors, which may contribute to their increased vascularity, and they have significantly lower endothelial cell pericyte coverage, which may contribute to their greater sensitivity to antiangiogenesis. Interestingly, high levels of VEGF receptor-2 were expressed on PC3 but not PC3/2G7 tumor cells, which may contribute to the growth static response of PC3 tumors to VEGF-targeted antiangiogenesis. Finally, prolonged antiangiogenic treatment led to resumption of PC3/2G7 tumor growth and neovascularization, indicating these cancer stem-like cell-derived tumors can adapt and escape from antiangiogenesis.


Conflict of interest statement

Disclosure of potential conflicts of Interest: The authors have no conflicts of interest to disclose.

Figures

Figure 1
Figure 1. Vascularity of PC3/2G7 and PC3 tumor models
A. Representative CD31 immunostained cryosections of PC3/2G7 and PC3 tumors showing high and low microvessel density, respectively (magnification, 10x). B. Quantification of CD31 immunostained PC3/2G7 and PC3 tumors (as in A) using NIH ImageJ software. Data are mean ± SE values based on stained cryosections from three different regions of n=7 PC3/2G7 tumors and n=6 PC3 tumors; **, p=0.0015, for vascular area of PC3/2G7 vs. PC3 (two-tailed student’s test). C. qPCR analysis of mouse endothelial cell marker VE-cadherin RNA levels. Shown are relative RNA levels based on n=10 PC3/2G7 tumors and n=12 PC3 tumors, mean ± SE; ***, p<0.0001, for PC3/2G7 vs. PC3 tumors, two-tailed student’s test. D. Functional blood vessels in PC3/2G7 and PC3 tumor cryosections (magnification, 4.2×) assessed by Hoechst 33342 perfusion. Shown are fluorescence microscopic images of PC3/2G7 and PC3 tumors and intestines (normal tissue positive control) after 12 days axitinib treatment, as indicated (‘Ax’) from mice killed 1 min after Hoechst 33342 injection.
Figure 2
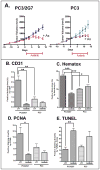
Figure 2. Anti-tumor activity of axitinib against PC3/2G7 and PC3 tumors
A. Effect of daily axitininb treatment (days 1–12) on tumor growth in male scid mice. Tumor volumes, mean ± SE, for n=10–14 tumor/group. B–E, Quantitative analysis of the effects of axitinib on: B, tumor microvessel density (CD31 staining); C, tumor cellularity (hematoxylin staining); D, tumor cell proliferation (PCNA staining); and E, apoptosis (TUNEL). Quantitation was determined using ImageJ. Data are mean ± SE values based on stained cryosections (magnification, 4.2×) from three different regions of n = 4 tumors/group. Representative stained images are shown in Supplemental Fig. 2. * p<0.05, ** p<0.01, *** p<0.001 by two-way ANOVA (A), or by two-tailed student’s t-test (B–E).
Figure 3
Figure 3. PC3/2G7 tumors are more responsive to sorafenib and DC101 than PC3 tumors
A. Hoechst 33342 staining of drug-free and 21-day sorafinib-treated or 27-day (10 cycle) DC101-treated PC3/2G7 and PC3 tumor cryosections. Mouse intestine from the tumor-bearing mice was used as a normal tissue control. B. CD31 stained tumors showing reduction of PC3 and PC3/2G7 tumor microvessel density to a similar low-level following sorafenib or DC101 treatment. C, D. Hematoxylin staining of viable tumor regions (C) and PCNA staining of proliferating cells (D) reveals greater decreases in PC3/2G7 tumors compared to PC3 tumors following treatment with sorafenib (21 days) or DC101 (27 days), as in Supplemental Figs. 3 and 4. Shown are representative images of stained cryosections (A) or paraffin-embedded sections (B-D) at 10× magnification.
Figure 4
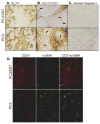
Figure 4. Hypoxia, basal apoptotic status, and pericyte coverage
A. Hypoxia marker GLUT1 staining of PC3/2G7 and PC3 tumors, showing more extensive regions of hypoxia in PC3 tumors. B. Double immunostaining of tumor hypoxia (GLUT1 staining, brown) and tumor microvessels (CD31, purple). Hypoxic regions (brown staining) are distant from tumor microvessels (arrows). C. Immunostaining for cleaved caspase-3, showing significantly fewer basal apoptotic regions in PC3/2G7 compared to PC3 tumors. Shown are representative paraffin-embedded sections at 20×. D. Immunofluorescence double-staining of endothelial cells (CD31, red) and pericytes (α-SMA, green) in PC3/2G7 and PC3 tumor cryosections. The two-color overlay (right) visualizes pericyte-covered vascular endothelial cells in yellow. Analysis was performed using an Olympus FSX100 Bio Imaging Navigator fluorescence microscope system. PC3/2G7 tumors show significantly lower pericyte coverage of endothelial cells than PC3 tumors (magnification, 4.2×).
Figure 5
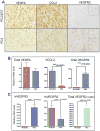
Figure 5. Expression of angiogenic factors by PC3/2G7 and PC3 tumors
A. Representative images showing VEGFA (40×), CCL2 (40×) and VEGFR2 (10×) immunostaining of PC3/2G7 and PC3 tumors. The anti-VEGFR2 antibody recognizes both human and mouse VEGFR2, the anti-CCL2 is a human-specific antibody, and the anti-VEGFA antibody recognizes both human and mouse VEGFA. Images of CCL2 and VEGFA were obtained from paraffin-embedded sections; VEGFR2 images were from cryosections. B and C, qPCR analysis was carried out for the indicated mouse (m) and human genes (h) using species-specific primers and RNA isolated from n=10 PC3/2G7 tumors and n=12 PC3 tumors. ‘Total’ indicates qPCR primers did not distinguish mouse from human RNAs. B. VEGFA, VEGFR2 and CCL2 RNA levels. VEGFR2 RNA was significantly down regulated in PC3/2G7 tumors compared to PC3 tumors (p<0.0001, ***, two-tailed student’s test); CCL2 was significantly increased in PC3/2G7 compared to PC3 tumors (p<0.0001, ***, two-tailed student’s test). C. VEGFR2 RNA assayed using primers specific for human VEGFR2 and mouse VEGFR2, respectively, and also primers recognizing both mouse and human VEGFR2 (total VEGFR2). PC3 tumor cells expressed dramatically higher level of human (i.e., tumor cell-associated) VEGFR2 compared to PC3/2G7 tumor cells.
Figure 6
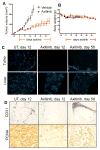
Figure 6. Response of PC3/2G7 tumors to long-term axitinib treatment
A. Change in mean tumor volume for daily axitinib-treated tumors over a 58-day period, with tumor re-growth resuming after day 20. B. Body weight measurements in mice bearing PC3/2G7 xenografts. Horizontal red lines along X-axis mark the axitinib treatment period. C. Change in functional blood vessels assayed by Hoechst 33342 perfusion in PC3/2G7 tumors analyzed after 12 or 58 days axitinib treatment (magnification, × 4.2). D. Changes in microvessel density (CD31 staining; magnification, 4.2×) and cell proliferation (PCNA staining; magnification, 20×) in PC3/2G7 tumors after 58 days axitinib treatment. Increased neovascularization near the tumor periphery and increased tumor cell proliferation were apparent at day 58. See Supplemental Fig. 8 for additional images of neovascularization after 58 days axitinib treatment.
Figure 7
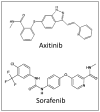
Figure 7
Chemical structures of axitinib and sorafenib

Similar articles

Cited by

References

    1. Johannessen TC, Wagner M, Straume O, Bjerkvig R, Eikesdal HP. Tumor vasculature: the Achilles’ heel of cancer? Expert Opin Ther Targets. 2013;17:7–20. - PubMed
    1. Eyler CE, Rich JN. Survival of the fittest: cancer stem cells in therapeutic resistance and angiogenesis. J Clin Oncol. 2008;26:2839–45. - PMC - PubMed
    1. Tang C, Ang BT, Pervaiz S. Cancer stem cell: target for anti-cancer therapy. FASEB J. 2007;21:3777–85. - PubMed
    1. Hanahan D, Folkman J. Patterns and emerging mechanisms of the angiogenic switch during tumorigenesis. Cell. 1996;86:353–64. - PubMed
    1. Tie J, Desai J. Antiangiogenic therapies targeting the vascular endothelia growth factor signaling system. Crit Rev Oncog. 2012;17:51–67. - PubMed

Publication types

MeSH terms