. 2013 Jun;123(6):2475-87.
doi: 10.1172/JCI63623. Epub 2013 May 1.

Inhibition of DYRK1A destabilizes EGFR and reduces EGFR-dependent glioblastoma growth

Affiliations

Inhibition of DYRK1A destabilizes EGFR and reduces EGFR-dependent glioblastoma growth

Natividad Pozo et al. J Clin Invest. 2013 Jun.

Abstract

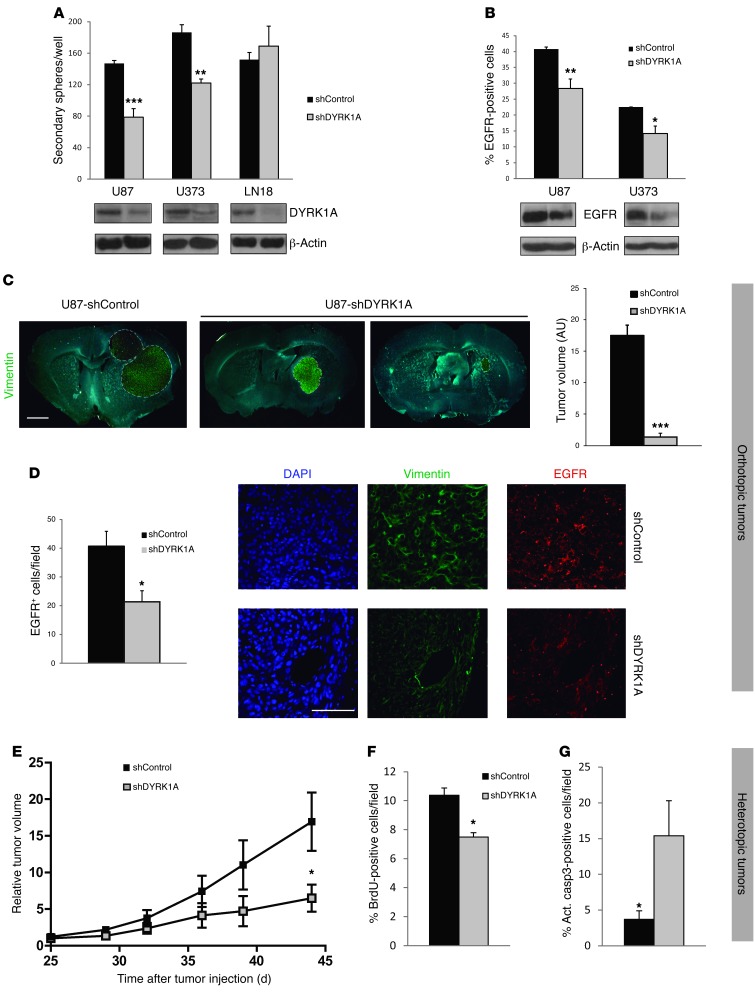
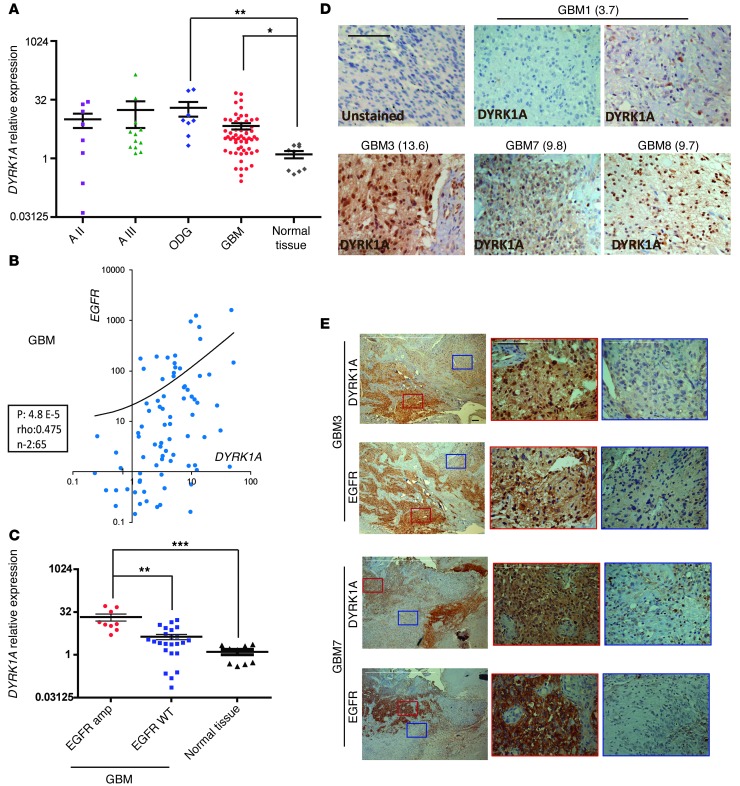
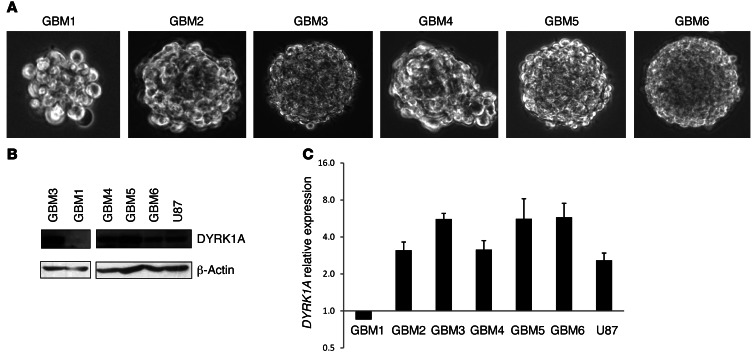
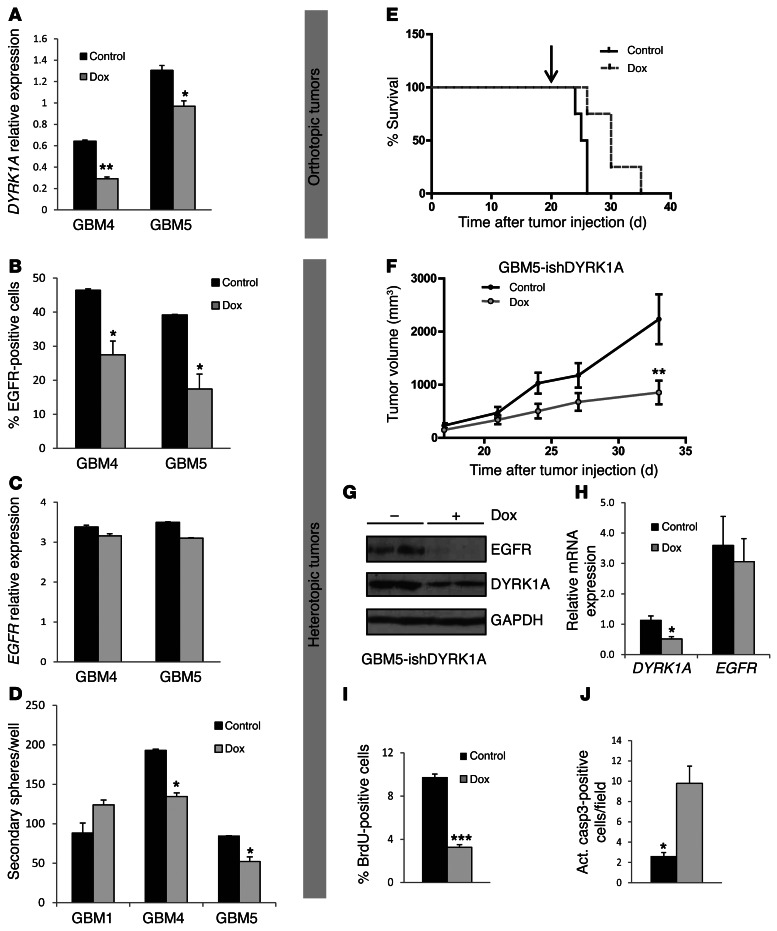
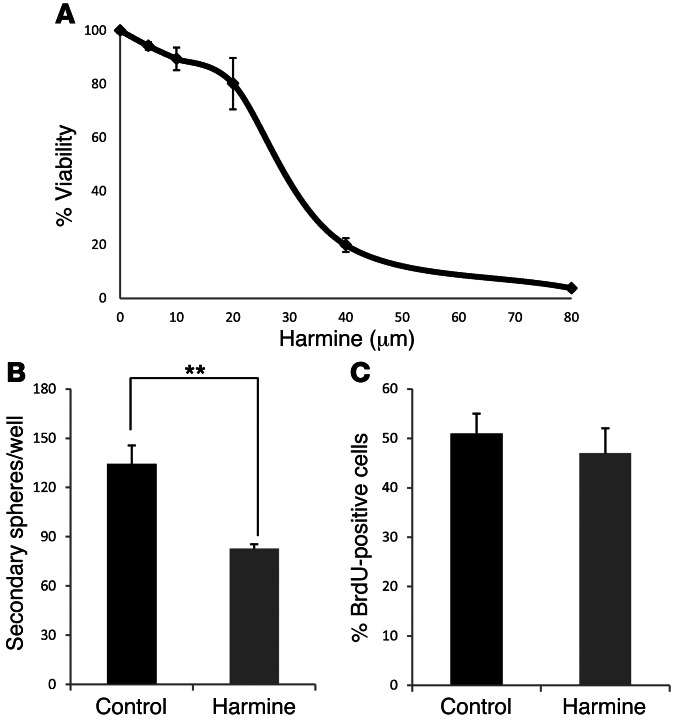
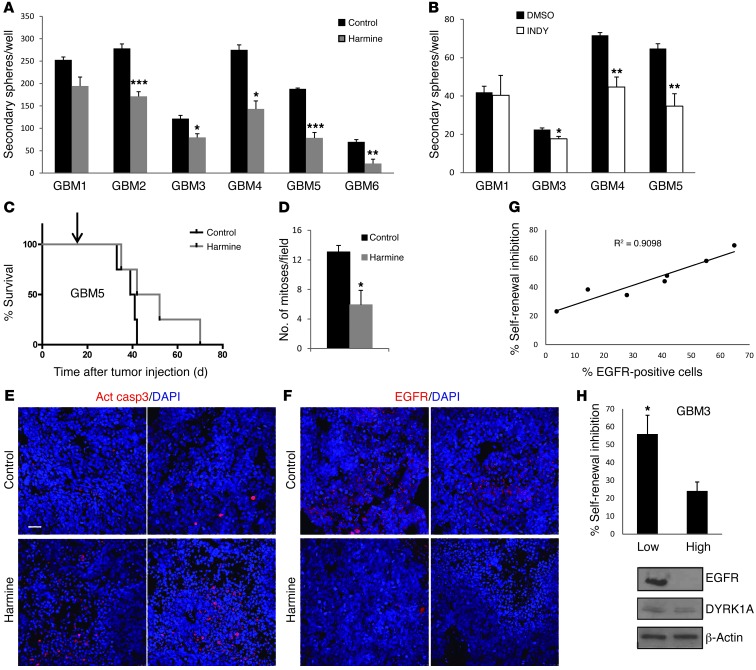
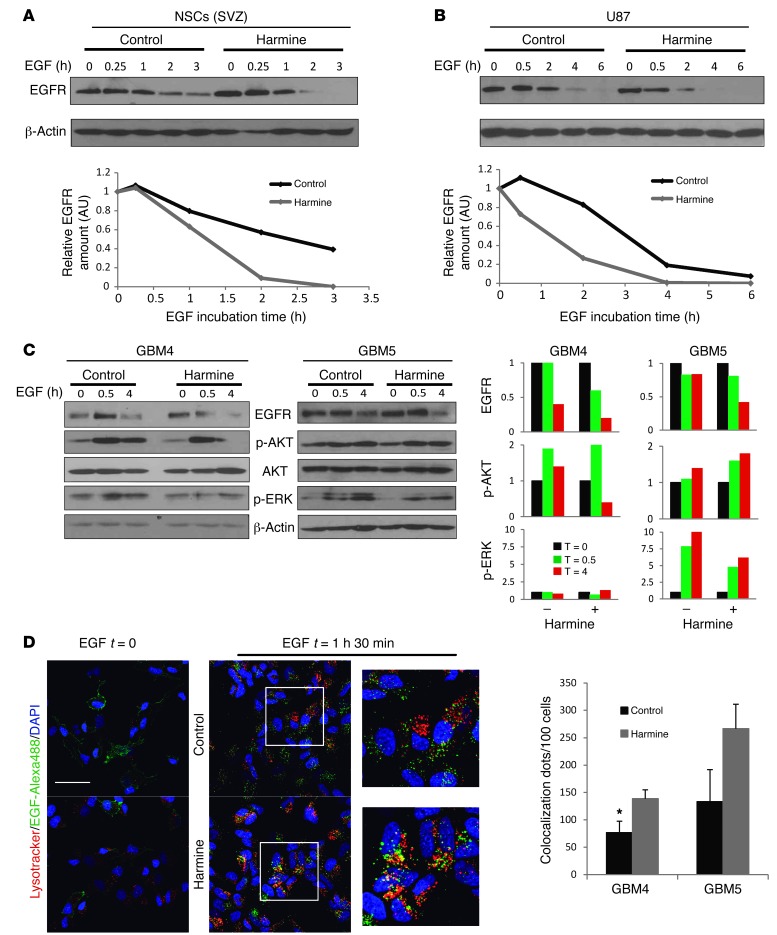
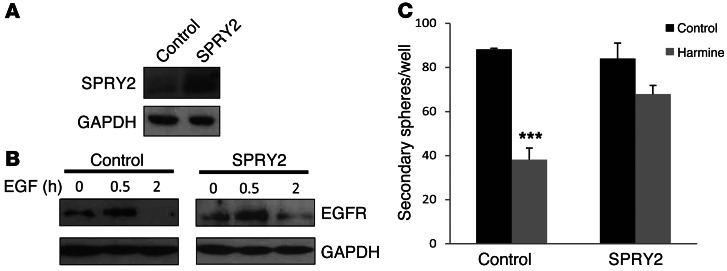
Glioblastomas (GBMs) are very aggressive tumors that are resistant to conventional chemo- and radiotherapy. New molecular therapeutic strategies are required to effectively eliminate the subpopulation of GBM tumor-initiating cells that are responsible for relapse. Since EGFR is altered in 50% of GBMs, it represents one of the most promising targets; however, EGFR kinase inhibitors have produced poor results in clinical assays, with no clear explanation for the observed resistance. We uncovered a fundamental role for the dual-specificity tyrosine phosphorylation-regulated kinase, DYRK1A, in regulating EGFR in GBMs. We found that DYRK1A was highly expressed in these tumors and that its expression was correlated with that of EGFR. Moreover, DYRK1A inhibition promoted EGFR degradation in primary GBM cell lines and neural progenitor cells, sharply reducing the self-renewal capacity of normal and tumorigenic cells. Most importantly, our data suggest that a subset of GBMs depends on high surface EGFR levels, as DYRK1A inhibition compromised their survival and produced a profound decrease in tumor burden. We propose that the recovery of EGFR stability is a key oncogenic event in a large proportion of gliomas and that pharmacological inhibition of DYRK1A could represent a promising therapeutic intervention for EGFR-dependent GBMs.


Figures

Figure 1
Figure 1. DYRK1A interference affects the levels of EGFR and the tumorigenic capacity of established GBM cell lines.
(A) GBM cell lines were infected with the shControl or shDYRK1A lentivirus, and the capacity to form secondary spheres was measured. Bottom Western blot panels illustrate the inhibition of kinase expression. (B) Flow cytometric analysis of the percentage of EGFR-positive cells after lentiviral infection of 2 GBM cell lines. Bottom Western blot panels display the amount of total EGFR protein. (C) Images show representative vimentin staining of tumors formed after implantation of 10,000 puromycin-selected shControl- or shDYRK1A-infected U87 cells. Graphs on the right show the quantification of tumor volume. (D) Number of EGFR-positive cells per tumorigenic field, with representative images shown on the right. (E) Puromycin-selected shControl- or shDYRK1A-infected U87 cells (3 × 10⁶) were implanted into the flanks of nude mice. Tumor size was measured once every 4–5 days. Relative tumor volume = tumor volume measured/tumor volume at day 25. (F) Proportion of BrdU-positive cells in shControl and shDYRK1A tumor tissues. (G) Number of activated caspase 3–positive (Act. casp3-positive) cells in the tumor tissues. Scale bars: 800 μm (C); 50 μm (D). *P ≤ 0.05; **P ≤ 0.01; ***P ≤ 0.001.
Figure 2
Figure 2. DYRK1A is highly expressed in a subset of gliomas and correlates with EGFR expression.
(A) DYRK1A transcript levels were determined by RT-PCR in glioma samples and normal tissue (obtained during surgery on epileptic patients). HPRT expression was used for normalization. (B) Correlation between the levels of EGFR and DYRK1A transcription in the GBM samples. Spearman’s rank correlation parameters are presented in the box. (C) Relative DYRK1A expression in EGFR-amplified (amp) and wild-type (WT) GBM samples. (D) IHC images showing an unstained control and 5 representative images of DYRK1A staining of 4 different GBMs. Relative DYRK1A RT-PCR values are shown in the brackets. (E) Low-magnification images of DYRK1A and EGFR staining of 2 different GBMs. Areas of positive (red box) and negative (blue box) staining of both markers are shown at higher magnification. A, astrocytomas. Scale bars: 50 μm. *P ≤ 0.05; **P ≤ 0.01; ***P ≤ 0.001.
Figure 3
Figure 3. Characterization of the GBM-TICs used in this study.
(A) Representative phase-contrast images of the different GBM-TICs. (B) DYRK1A protein expression in some of the GBM-TIC lines and U87 cells. (C) DYRK1A transcriptional levels relative to HPRT. Expression of DYRK1A in normal tissue was used for normalization.
Figure 4
Figure 4. Conditional DYRK1A interference affects EGFR levels and the tumorigenic capacity of GBM-TICs.
(A) RT-PCR analysis of DYRK1A transcripts 3 days after shDYRK1A induction with doxycycline (Dox). (B) Flow cytometric analysis of the amount of EGFR-positive cells 3 days after shDYRK1A induction. (C) RT-PCR analysis of EGFR transcripts 3 days after shDYRK1A induction. (D) Quantification of the capacity to form secondary spheres after doxycycline removal. (E) 50,000 GBM5 cells infected with inducible shDYRK1A (GBM5-ishDYRK1A) cells were implanted intracranially into nude mice, and 3 weeks later, doxycycline (indicated with an arrow) was added to the drinking water of 1 group of mice. Animal survival was evaluated using a Kaplan-Meier survival curve, and the differences in survival times were analyzed with a log-rank test (n = 4; P = 0.0316). (F) GBM5-ishDYRK1A cells (3.5 × 10⁶) were injected into the flanks of nude mice. Two weeks later, doxycycline was added to the drinking water of 1 group of mice, and tumor size was measured once every 4–5 days. Graph represents the tumor volume after doxycycline addition. (G) Western blot analysis of DYRK1A and EGFR protein levels in control and doxycycline-treated tumors. (H) RT-PCR analysis of DYRK1A and EGFR transcript levels in control and doxycycline-treated tumors. (I) Number of BrdU-positive cells in the flank tumors. (J) Amount of cells with activated caspase 3 in the flank tumors. *P ≤ 0.05; **P ≤ 0.01; ***P ≤ 0.001.
Figure 5
Figure 5. Harmine impairs the self-renewal capacity of SVZ-NSCs.
(A) SVZ neurospheres were treated for 2 days in the presence of different concentrations of harmine, and cell viability was measured with a colorimetric WST-1 assay. Percentage of inhibition is represented in the graph. (B) Formation of secondary spheres after pretreatment with harmine (20 μm for 2 days). **P ≤ 0.01. (C) Percentage of BrdU-positive cells in control and harmine-treated cells.
Figure 6
Figure 6. Pharmacological inhibition of DYRK1A impairs the self-renewal capacity of EGFR-expressing GBM-TICs.
GBM primary cells were incubated in the presence of (A) harmine or (B) INDY, and 3 days later, the spheres were dissociated and replated in the absence of the drug. A 20-μm concentration was chosen based on SVZ-NSC behavior (Figure 5A and Supplemental Figure 7). The number of secondary spheres is represented in the graphs. (C) 50,000 GBM5 cells were implanted intracranially into nude mice. Two weeks later, the animals started to receive i.p. injections of saline (Control) or harmine (15 mg/kg/day, 5 days per week; indicated by an arrow). Animal survival was evaluated using a Kaplan-Meier survival curve, and the differences in survival times were analyzed with a log-rank test (n = 5; P = 0.09). (D) Number of mitotic cells in control or harmine-treated tumor tissue. (E) Representative images of activated caspase 3 staining in control and harmine-treated tumor tissue. (F) Representative images of EGFR staining in control and harmine-treated tumor tissue. (G) Correlation between the amount of membrane EGFR present in the different GBM-TIC lines and the percentage of self-renewal inhibition induced by harmine. (H) Percentage of self-renewal inhibition induced by harmine in low- or high-passage GBM3 cells. Western blot on the right shows the amount of EGFR and DYRK1A expressed by low- and high-passage GBM3 cells. Scale bar: 40 μm. *P ≤ 0.05; **P ≤ 0.01; ***P ≤ 0.001.
Figure 7
Figure 7. DYRK1A inhibition stimulates EGFR lysosomal degradation and termination of EGF signaling.
Western blot analysis of SVZ-NSCs (A) or U87 cells (B) that were deprived of growth factors for 12 hours and then exposed to EGF for the indicated durations in the presence or absence of harmine. Quantification of EGFR levels relative to β-actin is shown in the bottom graphs. (C) Western blot analysis of the EGFR signaling pathway after EGF stimulation of 2 different GBM-TIC lines in the presence or absence of harmine. Quantification of EGFR, p-AKT, and p-ERK1/2 levels relative to β-actin is shown on the right. (D) GBM-TICs were preincubated in the presence or absence of harmine. Four hours later, EGF Alexa488 was added and the cells were fixed at t = 0 or t = 1 hour, 30 minutes. Representative confocal images of EGFR lysosomal targeting in GBM4 cells are shown. Quantification of the yellow dots for 2 different GBM-TIC lines is represented by the graph on the right. *P ≤ 0.05. Scale bar: 25 μm.
Figure 8
Figure 8. SPRY2 overexpression reverses the effect of harmine on EGFR degradation and GBM-TIC self-renewal.
(A) GBM5-TICs were infected with control or SPRY2-expressing retrovirus and 48 hours later, the cells were analyzed by Western blotting. (B) Control or SPRY2-expressing GBM5-TICs were deprived of growth factors for 12 hours and then EGF was added in the presence of harmine for the indicated durations. EGFR in the cells was analyzed by Western blotting. (C) Twenty-four hours after retroviral infection of GBM5-TICs, the cells were incubated in the presence or absence of harmine for 3 days. Dissociated cells were plated in the absence of the drug, and the number of secondary spheres formed was counted. ***P ≤ 0.001.

Similar articles

Cited by

References

    1. Louis DN, Ohgaki H, Wiestler OD, Cavenee WK. WHO Classification of Tumours of the Central Nervous System. 4th ed. Lyon, France: International Agency for Research on Cancer; 2007. - PubMed
    1. Stupp R, et al. Radiotherapy plus concomitant and adjuvant temozolomide for glioblastoma. N Engl J Med. 2005;352(10):987–996. doi: 10.1056/NEJMoa043330. - DOI - PubMed
    1. Chamberlain MC. Emerging clinical principles on the use of bevacizumab for the treatment of malignant gliomas. Cancer. 2010;116(17):3988–3999. doi: 10.1002/cncr.25256. - DOI - PubMed
    1. Singh SK, et al. Identification of human brain tumour initiating cells. Nature. 2004;432(7015):396–401. doi: 10.1038/nature03128. - DOI - PubMed
    1. Galli R, et al. Isolation and characterization of tumorigenic, stem-like neural precursors from human glioblastoma. Cancer Res. 2004;64(19):7011–7021. doi: 10.1158/0008-5472.CAN-04-1364. - DOI - PubMed

Publication types

MeSH terms