. 2013 Jun;123(6):2616-28.
doi: 10.1172/JCI64503. Epub 2013 May 1.

Efficacious proteasome/HDAC inhibitor combination therapy for primary effusion lymphoma

Affiliations

Efficacious proteasome/HDAC inhibitor combination therapy for primary effusion lymphoma

Shruti Bhatt et al. J Clin Invest. 2013 Jun.

Abstract

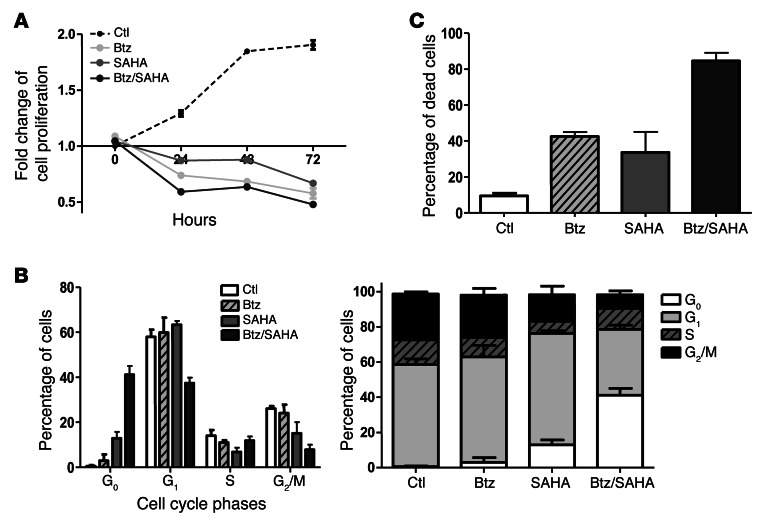
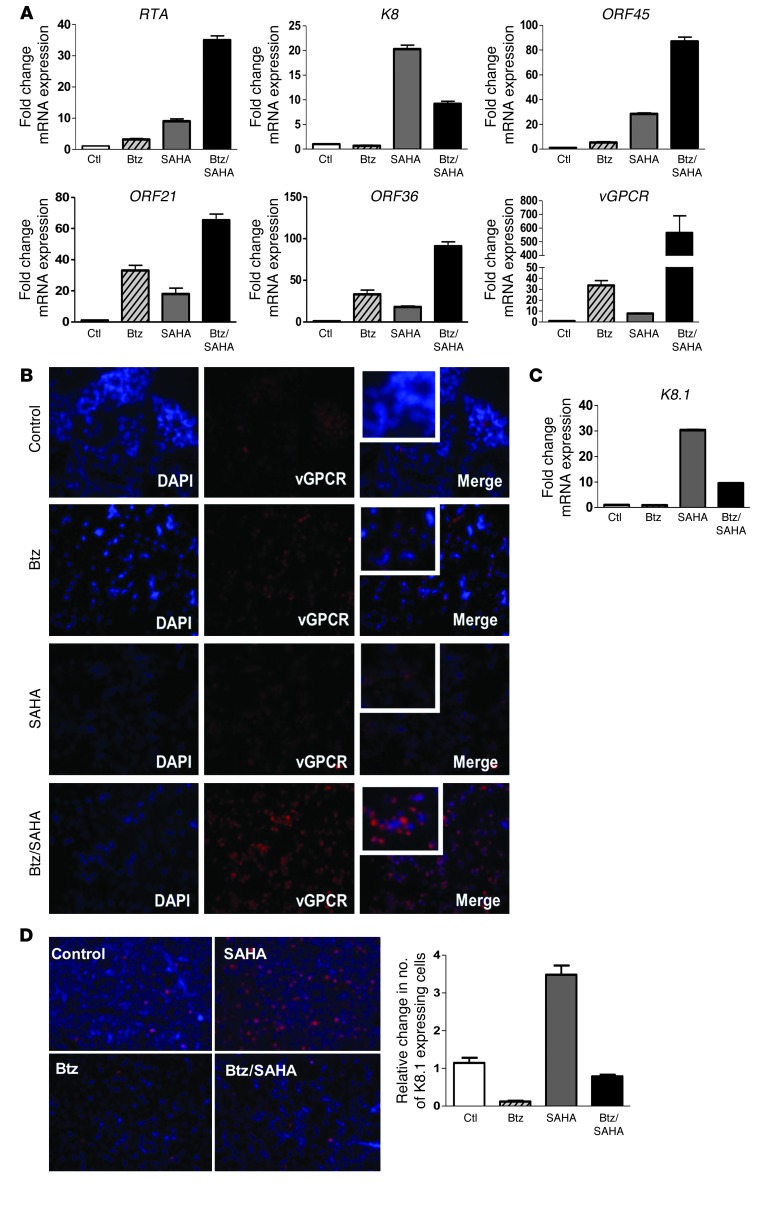
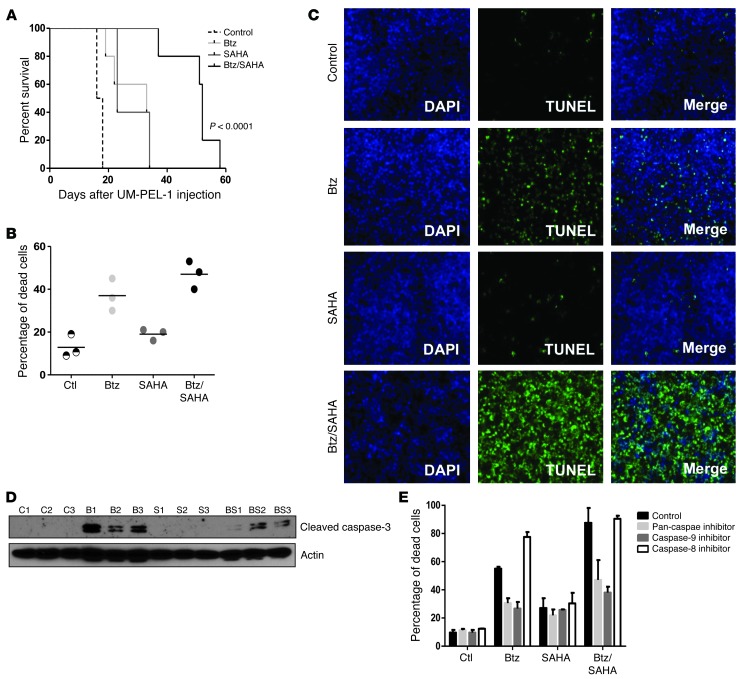
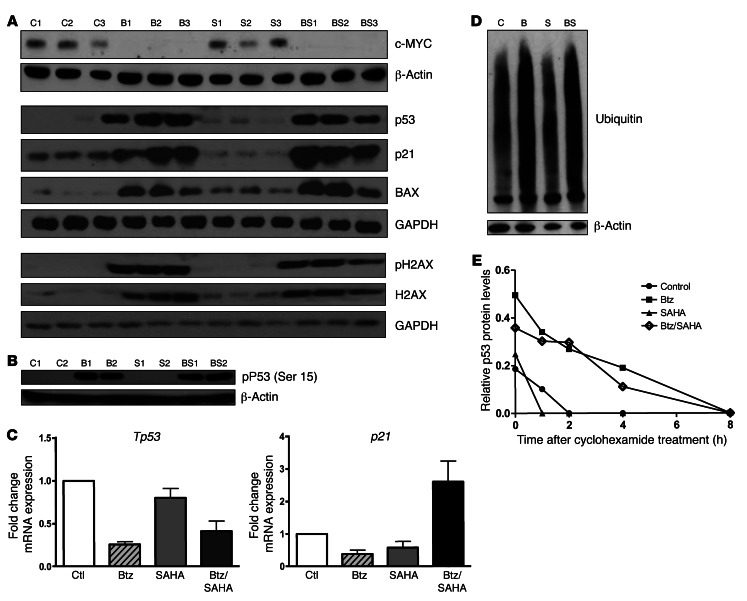
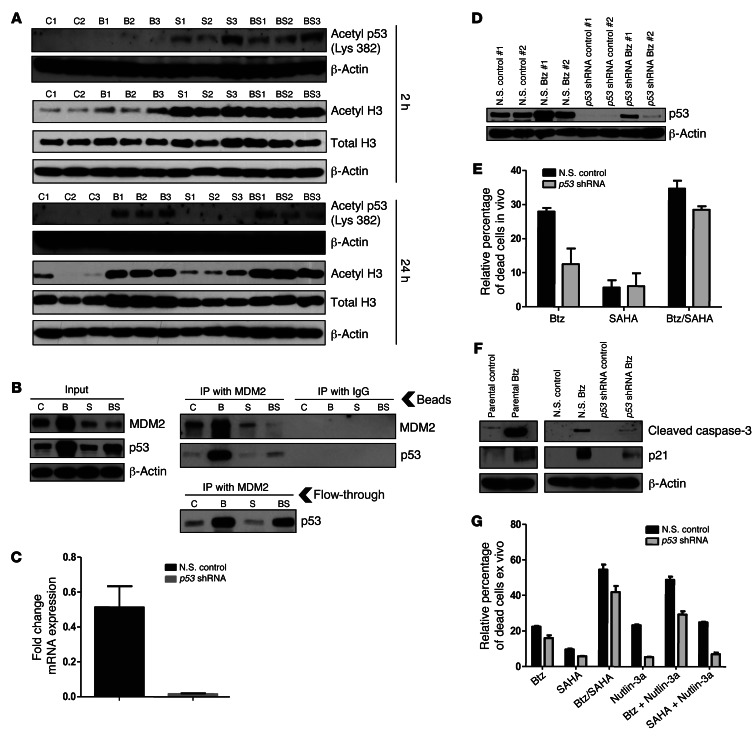
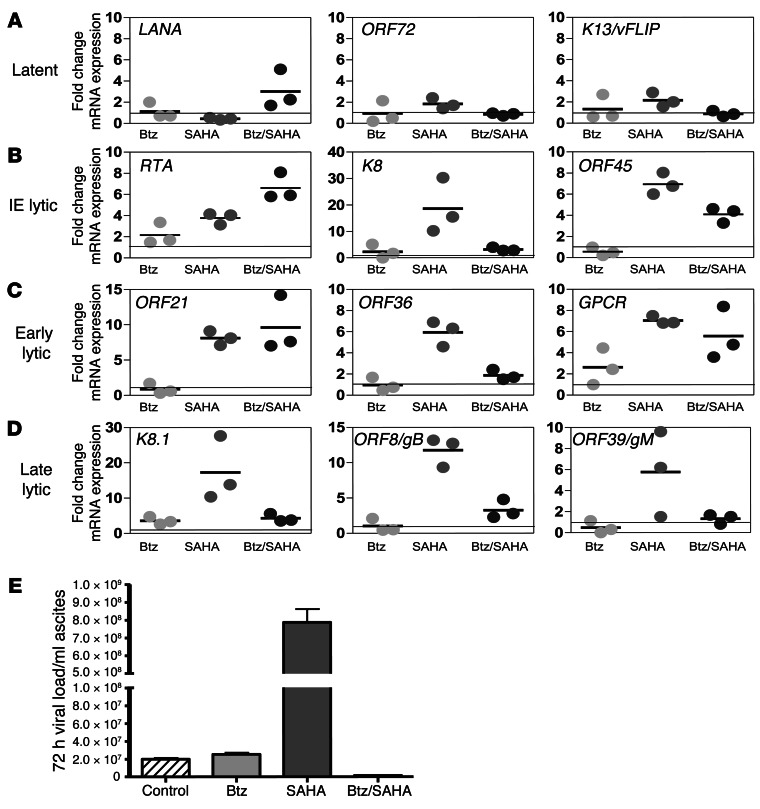
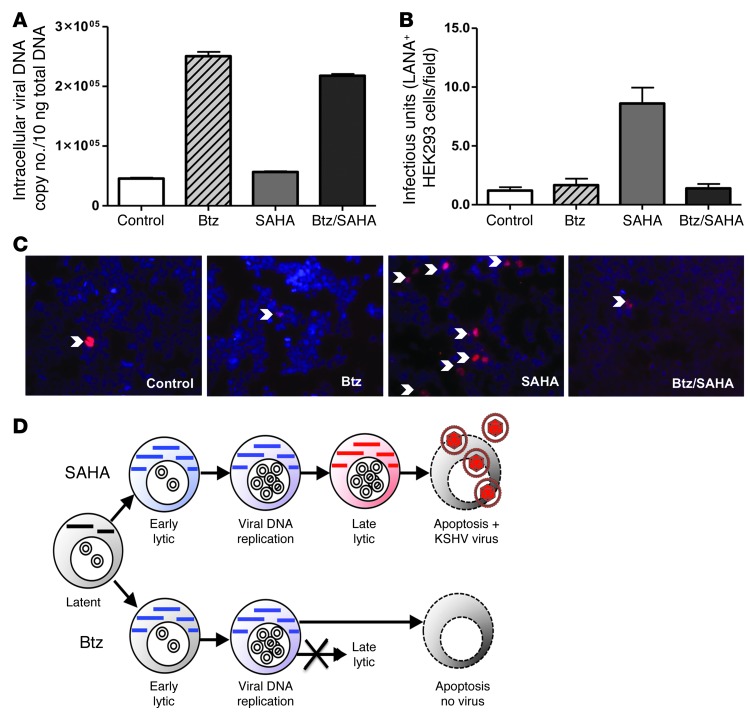
Primary effusion lymphoma (PEL) is a rare form of aggressive B cell lymphoma caused by Kaposi's sarcoma-associated herpesvirus (KSHV). Current chemotherapy approaches result in dismal outcomes, and there is an urgent need for new PEL therapies. Previously, we established, in a direct xenograft model of PEL-bearing immune-compromised mice, that treatment with the proteasome inhibitor, bortezomib (Btz), increased survival relative to that after treatment with doxorubicin. Herein, we demonstrate that the combination of Btz with the histone deacetylase (HDAC) inhibitor suberoylanilidehydroxamic acid (SAHA, also known as vorinostat) potently reactivates KSHV lytic replication and induces PEL cell death, resulting in significantly prolonged survival of PEL-bearing mice. Importantly, Btz blocked KSHV late lytic gene expression, terminally inhibiting the full lytic cascade and production of infectious virus in vivo. Btz treatment led to caspase activation and induced DNA damage, as evidenced by the accumulation of phosphorylated γH2AX and p53. The addition of SAHA to Btz treatment was synergistic, as SAHA induced early acetylation of p53 and reduced interaction with its negative regulator MDM2, augmenting the effects of Btz. The eradication of KSHV-infected PEL cells without increased viremia in mice provides a strong rationale for using the proteasome/HDAC inhibitor combination therapy in PEL.


Figures

Figure 1
Figure 1. The combination of Btz with SAHA inhibits proliferation, induces cell cycle arrest, and triggers apoptosis of UM-PEL-1 cells.
UM-PEL-1c cells were treated with 10 nM Btz, 0.75 μM SAHA, or 10 nM Btz/0.75 μM SAHA. (A) The fold change in cell proliferation, as assessed by MTS assay at 0, 24, 48, and 72 hours after treatment. (B) Analysis of the percentage of cells in different phases of the cell cycle (G0, G1, S, and G2/M) at 24 hours after treatment with the indicated drugs. Cells were stained with PI to measure DNA content and analyzed for cell cycle distribution by flow cytometry. ctl, control. (C) The percentage of dead cells measured by flow cytometric analysis of YO-PRO-1/PI–stained cells 24 hours after treatment. Experiments depicted in AC were repeated 3 times independently in triplicate. The representative data from 1 experiment is shown. Error bars represent SEM.
Figure 2
Figure 2. Btz and SAHA synergize to induce KSHV lytic replication, while concurrently inhibiting expression of selective lytic genes in UM-PEL-1c cells.
UM-PEL-1c cells were treated with 10 nM Btz, 0.5 μM SAHA, or 10 nM Btz/0.5 μM SAHA for 24 hours. (A and C) Total RNA was harvested for qRT-PCR analysis of viral mRNA expression. (B and D) Cells were cytospun and fixed, and immunofluorescence was performed for viral proteins. (A) qRT-PCR analysis reveals that Btz and SAHA induce expression of IE and early lytic viral mRNAs, with the exception of K8, which was inhibited by Btz. (B) The vGPCR protein was immunostained to determine the extent of viral reactivation. Widespread reactivation is seen in the cells treated with the Btz/SAHA combination. (C) K8.1, a late lytic viral gene, was inhibited by Btz at the transcript level. (D) Immunostaining images for K8.1 protein confirm the inhibition of K8.1 expression by Btz. K8.1 expression was normalized to DAPI to account for potential differences in cell number (left). Relative increase in K8.1-positive cells after treatment with SAHA alone and decrease in K8.1-positive cells after adding Btz was observed (right). Results are representative of 3 individual experiments. Error bars represent SEM. Original magnification, ×200 (B); ×100 (D).
Figure 3
Figure 3. Btz and SAHA combination prolongs survival of PEL-bearing mice by inducing apoptosis in PEL xenografts.
(A) Kaplan-Meier survival curve of NOD/SCID mice (n = 5 mice per group) injected i.p. with UM-PEL-1 cells and treated with indicated drug combinations, as described in Methods. Results are representative of 2 independent experiments. (BD) UM-PEL-1–bearing mice (n = 3) were treated separately with a single dose of DMSO (control [Ctl]), Btz, SAHA, or Btz/SAHA. At 24 hours, the mice were sacrificed and UM-PEL-1 cells were harvested. (B) In vivo apoptosis of UM-PEL-1 cells examined by YO-PRO-1/PI staining followed by flow cytometry. Each circle represents 1 mouse, and the horizontal bars indicate the mean percentage apoptosis. (C) Immunofluorescence images of TUNEL-stained (green, middle column) UM-PEL-1 cells harvested from peritoneal effusions. Nuclei are stained with DAPI (blue, left column). Merged images of DAPI and TUNEL are shown in the right column. TUNEL positivity is indicative of fragmented DNA, a characteristic of apoptotic cells. Original magnification, ×100. (D) Immunoblotting for cleaved caspase-3. β-Actin was used as normalizing control. C, DMSO control; B, Btz; S, SAHA, BS, Btz/SAHA. (E) UM-PEL-1c cells were pretreated with pan-caspase (Z-VAD-FMK), caspase-8 (Z-IETD-FMK; effector of extrinsic pathway), and caspase-9 (Z-LEHD-FMK; effector of intrinsic pathway) specific inhibitors (50 μM) for 2 hours, followed by treatment with 2.5 nM Btz, 0.5 μM SAHA, or 2.5 nM Btz/0.5 μM SAHA for 24 hours. The percentage of dead cells was measured by flow cytometric analysis of YO-PRO-1/PI–stained cells. Ctl, control cells not treated with Btz or SAHA. Error bars represent SEM between triplicate samples.
Figure 4
Figure 4. Btz downregulates c-MYC and stabilizes the expression of phosphorylated p53 and γH2AX and downstream p53 targets p21 and Bax in PEL xenografts.
(A) UM-PEL-1–bearing mice (n = 3 mice per group) were treated with DMSO as control or a single dose of Btz (0.3 mg/kg), SAHA (60 mg/kg), or the combination (Btz/SAHA) for 2 or 24 hours. UM-PEL-1 cells harvested from mouse ascites, and whole cell lysates were prepared for immunoblotting using the indicated antibodies. (B) UM-PEL-1–bearing mice (n = 2 mice per group) were treated as above, and immunoblotting for Ser-15–phosphorylated p53 (P-p53) was performed. (C) Fold change in p53 (Tp53) and p21 mRNA levels was measured using qRT-PCR analysis. Error bars indicate standard deviation between triplicate samples. Data are representative of 2 independent experiments. Ctl, DMSO-treated control. (D) Immunoblotting for Lys-48 polyubiquitin using UM-PEL-1 whole lysates following 24 hours treatment in vivo. (E) UM-PEL-1–bearing mice were treated with a single dose (as indicated in A) of Btz, SAHA, and the Btz/SAHA combination. At 24 hours after treatment, UM-PEL-1 cells were harvested and exposed to cycloheximide (50 μM) in culture. At the indicated time periods (ranging from 0 to 8 hours), p53 protein levels were measured by immunoblotting and quantified by densitometry. The half-life of p53 was determined by plotting p53 levels normalized to GAPDH (y axis) and time after treatment with cycloheximide (x axis). Note the higher starting amounts of p53 in the Btz and Btz/SAHA treatment groups.
Figure 5
Figure 5. SAHA-induced acetylation of p53 led to dissociation from MDM2, contributing to cell apoptosis.
(A and B) Tumor-bearing mice were treated with a single dose of DMSO, SAHA, Btz, or Btz/SAHA, and cell protein lysates were prepared from peritoneal effusions. (A) Immunoblotting for acetylated p53 (Lys-382) and H3 at 2 hours and 24 hours after treatment. (B) Immunoblots for MDM2 and p53 in whole cell lysates prior to immunoprecipitation (left). Immunoblots showing MDM2 and p53 in complexes captured by immunoprecipitation using indicated antibodies (right top). Complex-free p53 in flow through supernatant not captured in MDM2 antibody resin bead complexes (right bottom). (CF) UM-PEL-1 cells stably expressing p53-specific shRNA or nonsilencing (N.S.) vectors were passaged as xenografts in mice. Mice (n = 2 per group) were treated with a single dose of DMSO, Btz, SAHA, or Btz/SAHA, and at 24 hours, cells were harvested from peritoneal effusions. (C and D) shRNA-mediated knockdown of p53 at the mRNA level in untreated UM-PEL-1 cells and partial abrogation of Btz-induced p53 levels measured by qRT-PCR and immunoblotting. (E) In vivo apoptosis of UM-PEL-1 cells examined by YO-PRO-1/PI staining, followed by flow cytometry. Data represent values relative to normalized DMSO-treated control mice. (F) Immunoblotting of p21 and activated caspase-3. (G) UM-PEL-1 cells harvested from p53 shRNA– or nonsilencing vector–expressing xenograft mice were treated in culture with 2.5 nM Btz, 0.5 μM SAHA, 7 μM nutlin-3a, or indicated combinations for 24 hours. The percentage of dead cells was measured by annexin V/PI staining. Data represent values relative to normalized untreated cells. (AC) Experiments were repeated twice in triplicates. Error bars represent SEM.
Figure 6
Figure 6. Btz/SAHA potently induces KSHV lytic reactivation in vivo, while Btz inhibits the expression of key genes required to complete replicative cycle, resulting in inhibition of virus production.
(AD) Tumor-bearing mice were treated for 24 hours with indicated drugs, and UM-PEL-1 cells were harvested from peritoneal effusions for qRT-PCR analysis. The gray-colored long solid lines at “1” on the y axes represent the averaged value of DMSO-treated control mice to which the experimental mice were normalized. Each circle represents 1 mouse, and the horizontal bars indicate the mean fold induction. mRNA expression of KSHV (A) latent, (B) IE lytic, (C) early lytic, and (D) late lytic gene expression. Results are representative of 2 independent experiments. (E) Tumor-bearing mice were treated with a single dose of Btz, SAHA, or combination Btz/SAHA for 72 hours. Peritoneal effusions were harvested for virion quantification. The graph depicts the number of encapsidated viral DNA copies normalized to the volume of ascites recovered from a representative mouse. Error bars are SEM of quintuplicate wells.
Figure 7
Figure 7. Btz induces accumulation of viral DNA, with concomitant inhibition of infectious virion production.
(A) Cultured UM-PEL-1c cells were treated for 72 hours with 10 nM Btz, 0.5 μM SAHA, or the 10 nM Btz/0.5 μM SAHA combination. Total intracellular DNA was isolated, and 10 ng was used for qPCR viral load determination. (B and C) Cell-free supernatant from PBS-treated (Control-treated), Btz-treated, SAHA-treated, or Btz/SAHA–treated cells was applied to uninfected HEK293 cells. Forty-eight hours later, the cells were fixed and stained for LANA. For graphing purposes, 1 non-doublet LANA-positive 293 cell was defined as 1 infectious unit. Immunofluorescence of a representative field for each condition is shown. Results are representative of 2 independent experiments. Error bars represent SEM. Original magnification, ×200. (D) Mechanism of action for SAHA, Btz, and the combination. SAHA induces the full KSHV lytic cycle, leading to virus production and apoptosis. Btz also induces the lytic cycle, but it also blocks late lytic gene expression, leading to apoptosis in the absence of virus production. In the combination, SAHA and Btz synergize to induce the lytic cycle; however, the presence of Btz inhibits the completion of the lytic cycle, resulting in massive apoptosis in the absence of virus production.

Similar articles

Cited by

References

    1. Cesarman E, Chang Y, Moore PS, Said JW, Knowles DM. Kaposi’s sarcoma-associated herpesvirus-like DNA sequences in AIDS-related body-cavity-based lymphomas. N Engl J Med. 1995;332(18):1186–1191. doi: 10.1056/NEJM199505043321802. - DOI - PubMed
    1. Chang Y, et al. Identification of herpesvirus-like DNA sequences in AIDS-associated Kaposi’s sarcoma. Science. 1994;266(5192):1865–1869. doi: 10.1126/science.7997879. - DOI - PubMed
    1. Cesarman E, Mesri EA. Pathogenesis of viral lymphomas. Cancer Treat Res. 2006;131:49–88. - PubMed
    1. Jones D, et al. Primary-effusion lymphoma and Kaposi’s sarcoma in a cardiac-transplant recipient. N Engl J Med. 1998;339(7):444–449. doi: 10.1056/NEJM199808133390705. - DOI - PubMed
    1. Carbone A, Cesarman E, Spina M, Gloghini A, Schulz TF. HIV-associated lymphomas and gamma-herpesviruses. Blood. 2009;113(6):1213–1224. doi: 10.1182/blood-2008-09-180315. - DOI - PubMed

Publication types

MeSH terms