. 2013 Jun;123(6):2509-22.
doi: 10.1172/JCI67250. Epub 2013 May 1.

Lung tumor NF-κB signaling promotes T cell-mediated immune surveillance

Affiliations

Lung tumor NF-κB signaling promotes T cell-mediated immune surveillance

Emily L Hopewell et al. J Clin Invest. 2013 Jun.

Abstract

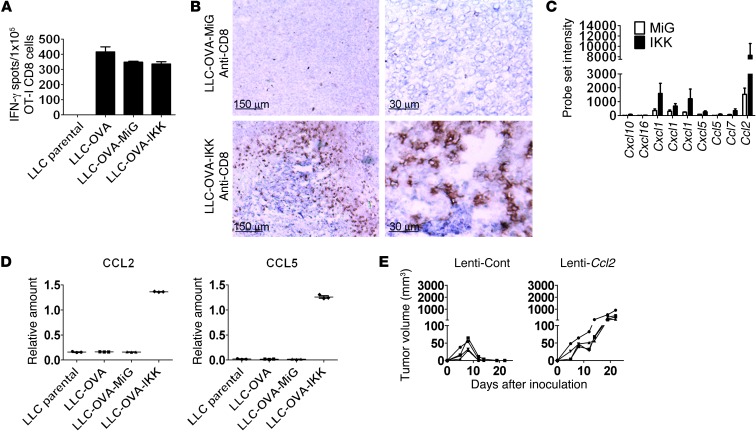
NF-κB is constitutively activated in many cancer types and is a potential key mediator of tumor-associated inflammation, tumor growth, and metastasis. We investigated the role of cancer cell NF-κB activity in T cell-mediated antitumor responses. In tumors rendered immunogenic by model antigen expression or following administration of antitumor vaccines, we found that high NF-κB activity leads to tumor rejection and/or growth suppression in mice. Using a global RNA expression microarray, we demonstrated that NF-κB enhanced expression of several T cell chemokines, including Ccl2, and decreased CCL2 expression was associated with enhanced tumor growth in a mouse lung cancer model. To investigate NF-κB function in human lung tumors, we identified a gene expression signature in human lung adenocarcinoma cell lines that was associated with NF-κB activity level. In patient tumor samples, overall lung tumor NF-κB activity was strongly associated with T cell infiltration but not with cancer cell proliferation. These results therefore indicate that NF-κB activity mediates immune surveillance and promotes antitumor T cell responses in both murine and human lung cancer.


Figures

Figure 1
Figure 1. Impact of IKKβ-induced NF-κB on tumor rejection.
(A) EMSA showing NF-κB nuclear levels and (B) RT-PCR showing Cxcl1 expression in LLC-OVA transduced with control MiG, IKK, and MiG treated with TNF-α for 1 and 2 hours. Samples were run in triplicate (mean ± SEM). Tumor growth in C57BL/6 mice inoculated s.c. with (C) nonimmunogenic LLC-MiG and LLC-IKK and (D) immunogenic LLC-OVA-MiG and LLC-OVA-IKK. (E) Impact of immunogenic LLC tumors on peripheral T cells. Tetramer analysis of day-10 OVA-specific CD8 T cells in peripheral blood from naive mice or mice receiving LLC-OVA-MiG or LLC-OVA-IKK cells s.c. Each point represents a single mouse. *P = 0.5485, Student’s t test comparing tetramer+ CD8 T cells between mice receiving LLC-OVA-MiG and LLC-OVA-IKK tumors. (F) C57BL/6 mice received s.c. LLC-OVA-MiG or LLC-OVA-IKK, and tumor growth was monitored. Relative fold increase in tumor volume in mice at day 21 after inoculation compared with day 4 after inoculation. Combined results from 3 independent experiments are shown (n = 11 for both groups). (G) Tumor growth in Rag2–/– mice inoculated s.c. with LLC-OVA-MiG or LLC-OVA-IKK and (H) 129S4/SvJaeJ mice inoculated s.c. with immunogenic LKR-OVA-MiG and LKR-OVA-IKK. (I) C57BL/6 BALB/c F1 mice received s.c. TUBO-MiG or TUBO-IKK. After 5 days, half of the mice in each group received HER2 TriVax. Tumor growth of all mice was calculated at day 21 relative to day 5. Relative growth in vaccinated mice was compared with unvaccinated counterparts. *P = 0.0256, t test with Welch’s correction. Graph shows combined results of 2 independent experiments. (C, D, G, and H) Each line represents a single mouse. (F and I) Each point represents tumor growth from a single mouse.
Figure 2
Figure 2. LLC growth in a metastatic model of lung cancer.
(A) Growth of LLC in a metastatic model of lung cancer. H&E staining of lungs from mice 24 days after receiving i.v. nonimmunogenic LLC-MiG or LLC-IKK or immunogenic LLC-OVA-MiG or LLC-OVA-IKK. Scale bars: 4 mm. (BD) LLC-OVA-IKK–injected mice showing the presence of microscopic foci together with lymphocytic infiltrates. (B) Larger lesions showed lymphocytic infiltrates peripherally and within tumors, (C and D) while smaller foci showed numerous lymphocytes with few remaining tumor cells. Tumor cells (T) and lymphocytic infiltrates (L) are indicated. Scale bars: 50 μM.
Figure 3
Figure 3. Impact of T cell chemokines on tumor rejection.
(A) IFN-γ production by OT-1 CD8 T cells. ELISpot of OT-I T cells cultured with LLC parental, LLC-OVA, LLC-OVA-MiG, or LLC-OVA-IKK tumor cells (1 × 10⁵ LLC cells per well; 1 × 10⁵ T cells per well). Samples were run in triplicate (mean ± SEM). (B) C57BL/6 mice received s.c. LLC-OVA-MiG or LLC-OVA-IKK. Tumors were excised at day 9, and CD8 expression was determined using IHC. Typical results from 1 mouse per group out of 4 mice is shown. Scale bars: 150 μm (left); 30 μm (right). (C) Affymetrix probe set signal intensity of indicated chemokines in LLC-OVA-IKK compared with that in LLC-OVA-MiG. Genes identified in 2 separate microarray experiments are shown (mean ± SEM). (D) RT-PCR showing CCL2 and CCL5 expression in LLC parental, LLC transduced with OVA, and LLC transduced with OVA and MiG or OVA and IKK. Samples were run in triplicate (average ± SEM). (E) Lentivirus-expressing scrambled shRNA (Lenti-Cont) and LLC-OVA-IKK Ccl2 shRNA (Lenti-Ccl2) cells were injected s.c. in C57BL/6 mice, and tumor growth was monitored. Each line represents tumor growth in a single mouse. All results are representative of at least 2 independent experiments.
Figure 4
Figure 4. Generation and validation of a lung cancer NF-κB signature.
(A) EMSA analysis of sorted H23, PC9, and HCC827 cells infected with GFP, IκBαSR, or CA-IKKβ retroviruses. Parental (Par) cells were not infected. The major NF-κB complexes are indicated with arrows. The upper complex corresponds to NF-κB subunit heterodimers, while the lower complex corresponds to homodimers. (B) NF-κB signature scores were determined by building a classifier to determine relative signature activity in different T cell lines (Supplemental Methods and Supplemental Table 3). Each “x” represents an individual microarray experiment. The median of the relative signature activity in all cell lines used for this analysis is also indicated. (C) H1299, H157, and H226 cells were transduced with MiG or IκBαSR retroviruses, following which TNFAIP3 and BIRC3 mRNA was determined by RT-PCR (mean ± SEM). (D) Expression of CCL2, CCL5, CXCL1CXCL3, and IL8 was determined in H157 cells transduced with MiG and IκBαSR (mean ± SEM). (E) NF-κB activity determined by EMSA in NF-κB signature low and high cell lines. Major NF-κB complexes are indicated with arrows.
Figure 5
Figure 5. Association of T cell chemokines, but not neutrophil chemokines, with T cell presence in human lung adenocarcinoma.
(A) Correlation plot based on Spearman correlation r values of CMCLA gene expression data in human adenocarcinomas (n = 442) for T cell chemokines (CCL2, CCL5, and CXCL10), neutrophil chemokines (CXCL1CXCL3 and IL8), and T cell receptor (TRAC and TRBC1) genes. Gene names and Affymetrix probe set ID numbers are shown. (B) Correlation r values of LTβ expression with neutrophil chemokines, T cell chemokines, and T cell presence in CMCLA data set (n = 442). Gene name and Affymetrix probe set ID numbers for genes with 2 probe sets are shown. (C) mRNA expression of indicated genes normalized to 18s rRNA in HCC827 lung cancer cells determined by RT-PCR. Fold difference in expression of genes after LTα1/β2 treatment compared with untreated cells is shown. Samples were run in triplicate (mean ± SEM). (D) mRNA expression of indicated genes normalized to 18s rRNA in HCC827 lung cancer cells determined by RT-PCR. Fold difference in expression of genes after TNF-α treatment compared with untreated cells is shown. Samples were run in triplicate (mean ± SEM).
Figure 6
Figure 6. Association of NF-κB signature inflammatory genes with patient survival.
Association of mRNA expression of indicated inflammatory genes (Affymetrix probe set IDs are shown) with OS in CMCLA data set (n = 442). 5-year OS of patients exhibiting high versus low expression of indicated genes using a median cutoff. Kaplan-Meier method was used to generate survival curves, and the log-rank test was used to test survival difference between the low and high expression groups by median cutoff for each gene. The P values shown were adjusted by false discovery rate for multiple testing. Patients alive after different time periods in high and low expression (Exprs) groups (each starting with n = 221) are indicated above the x axis.
Figure 7
Figure 7. Association of NF-κB signature immune response genes and T cell presence with patient survival.
(AD) Association of mRNA expression of indicated immune response genes (Affymetrix probe set IDs are shown) with OS in CMCLA (n = 442). 5-year OS of patients exhibiting high versus low expression of indicated genes using a median cutoff. Kaplan-Meier method was used to generate survival curves, and the log-rank test was used to test survival difference between the low and high expression groups by median cutoff for each gene. The P values shown were adjusted by false discovery rate for multiple testing. (E) Association of T cell presence detected by expression of T cell receptor genes (TRAC and TRBC1) on patient survival was determined as with above genes. Patients alive after different time periods in high and low expression (Exprs) groups (each starting with n = 221) are indicated above the x axis.
Figure 8
Figure 8. Association of T cell presence with NF-κB activity in human lung cancer.
(A) Spearman correlation plot with r value of NF-κB signature (159 probe sets) PC1 with T cell PC1 are shown for CMCLA data (n = 442). (B) Correlation plot of NF-κB signature (159 probe sets) PC1 with MR signature PC1. (C) Correlation plot of NF-κB signature PC1 (159 probe sets) with 10-gene NF-κB signature PC1. (D) Correlation plot of T cell PC1 with 10-gene NF-κB signature PC1. (E) Correlation plot of MR signature PC1 with 10-gene NF-κB signature PC1.

Similar articles

Cited by

References

    1. Sharma SV, Bell DW, Settleman J, Haber DA. Epidermal growth factor receptor mutations in lung cancer. Nat Rev Cancer. 2007;7(3):169–181. doi: 10.1038/nrc2088. - DOI - PubMed
    1. Downward J. Targeting RAS signalling pathways in cancer therapy. Nat Rev Cancer. 2003;3(1):11–22. doi: 10.1038/nrc969. - DOI - PubMed
    1. Downward J. Targeting RAS and PI3K in lung cancer. Nat Med. 2008;14(12):1315–1316. doi: 10.1038/nm1208-1315. - DOI - PubMed
    1. Shaw AT, Yasothan U, Kirkpatrick P. Crizotinib. Nat Rev Drug Discov. 2011;10(12):897–898. doi: 10.1038/nrd3600. - DOI - PubMed
    1. Hodi FS, et al. Improved survival with ipilimumab in patients with metastatic melanoma. N Engl J Med. 2010;363(8):711–723. doi: 10.1056/NEJMoa1003466. - DOI - PMC - PubMed

Publication types

MeSH terms

Associated data