

Can we detect oceanic biodiversity hotspots from space?
- PMID: 23635866
- PMCID: PMC3965306
- DOI: 10.1038/ismej.2013.72
Can we detect oceanic biodiversity hotspots from space?
Abstract
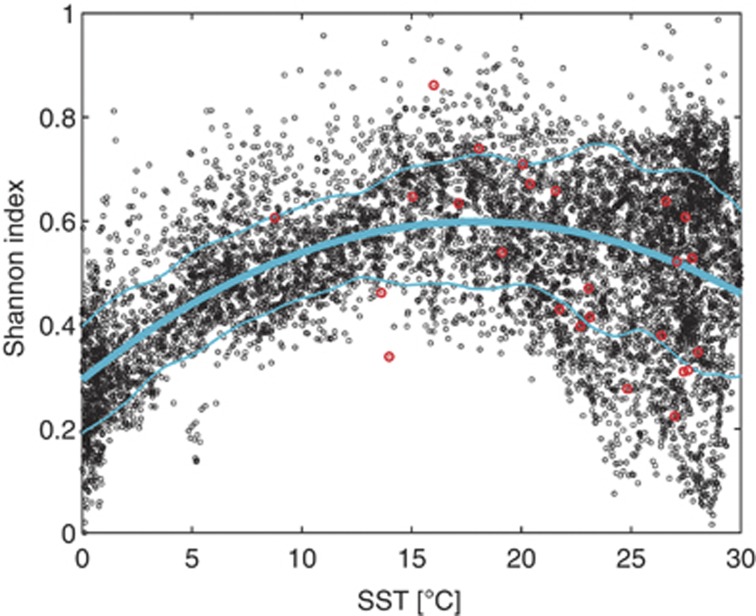
Understanding the variability of marine biodiversity is a central issue in microbiology. Current observational programs are based on in situ studies, but their implementation at the global scale is particularly challenging, owing to the ocean extent, its temporal variability and the heterogeneity of the data sources on which compilations are built. Here, we explore the possibility of identifying phytoplanktonic biodiversity hotspots from satellite. We define a Shannon entropy index based on patchiness in ocean color bio-optical anomalies. This index provides a high resolution (1 degree) global coverage. It shows a relation to temperature and mid-latitude maxima in accordance with those previously evidenced in microbiological biodiversity model and observational studies. Regional maxima are in remarkable agreement with several known biodiversity hotspots for plankton organisms and even for higher levels of the marine trophic chain, as well as with some in situ planktonic biodiversity estimates (from Atlantic Meridional Transect cruise). These results encourage to explore marine biodiversity with a coordinated effort of the molecular, ecological and remote sensing communities.
Figures

Similar articles
-
Estimating planktonic diversity through spatial dominance patterns in a model ocean.Mar Genomics. 2016 Oct;29:9-17. doi: 10.1016/j.margen.2016.04.015. Epub 2016 May 17. Mar Genomics. 2016. PMID: 27210279
-
Distributions of phytoplankton carbohydrate, protein and lipid in the world oceans from satellite ocean colour.ISME J. 2018 Jun;12(6):1457-1472. doi: 10.1038/s41396-018-0054-8. Epub 2018 Feb 12. ISME J. 2018. PMID: 29434313 Free PMC article.
-
A Satellite-Based Lagrangian View on Phytoplankton Dynamics.Ann Rev Mar Sci. 2018 Jan 3;10:99-119. doi: 10.1146/annurev-marine-121916-063204. Epub 2017 Sep 29. Ann Rev Mar Sci. 2018. PMID: 28961072
-
[Review of estimation on oceanic primary productivity by using remote sensing methods.].Ying Yong Sheng Tai Xue Bao. 2016 Sep;27(9):3042-3050. doi: 10.13287/j.1001-9332.201609.034. Ying Yong Sheng Tai Xue Bao. 2016. PMID: 29732871 Review. Chinese.
-
Spaceborne Lidar in the Study of Marine Systems.Ann Rev Mar Sci. 2018 Jan 3;10:121-147. doi: 10.1146/annurev-marine-121916-063335. Epub 2017 Sep 27. Ann Rev Mar Sci. 2018. PMID: 28961071 Free PMC article. Review.
Cited by
-
Stratifying ocean sampling globally and with depth to account for environmental variability.Sci Rep. 2018 Jul 26;8(1):11259. doi: 10.1038/s41598-018-29419-1. Sci Rep. 2018. PMID: 30050102 Free PMC article.
-
Bacterioplankton Biogeography of the Atlantic Ocean: A Case Study of the Distance-Decay Relationship.Front Microbiol. 2016 Apr 26;7:590. doi: 10.3389/fmicb.2016.00590. eCollection 2016. Front Microbiol. 2016. PMID: 27199923 Free PMC article.
-
The role of submesoscale currents in structuring marine ecosystems.Nat Commun. 2018 Nov 12;9(1):4758. doi: 10.1038/s41467-018-07059-3. Nat Commun. 2018. PMID: 30420651 Free PMC article. Review.
-
Contrasting biogeography and diversity patterns between diatoms and haptophytes in the central Pacific Ocean.Sci Rep. 2018 Jul 19;8(1):10916. doi: 10.1038/s41598-018-29039-9. Sci Rep. 2018. PMID: 30026492 Free PMC article.
-
The dynamical landscape of marine phytoplankton diversity.J R Soc Interface. 2015 Oct 6;12(111):20150481. doi: 10.1098/rsif.2015.0481. J R Soc Interface. 2015. PMID: 26400196 Free PMC article.
References
-
- Alvain S, Moulin C, Dandonneau Y, Loisel H. Seasonal distribution and succession of dominant phytoplankton groups in the global ocean: a satellite view. Global Biogeochem Cy. 2008;22:GB3001.
-
- Barton AD, Dutkiewicz S, Flierl G, Bragg J, Follows MJ. Patterns of diversity in marine phytoplankton. Science. 2010;327:1509–1511. - PubMed
-
- Block BA, Jonsen ID, Jorgensen SJ, Winship AJ, Shaffer SA, Bograd SJ, et al. Tracking apex marine predator movements in a dynamic ocean. Nature. 2011;475:86–90. - PubMed
-
- Cermeño P, Marañón E, Harbour D, Figueiras GF, Crespo GB, Huete-Ortega M, et al. Resource levels, allometric scaling of population abundance, and marine phytoplankton diversity. Limnol Oceanogr. 2008;53:312–318.
Publication types
MeSH terms
LinkOut - more resources
Full Text Sources
Other Literature Sources
