. 2013 Sep;84(3):468-81.
doi: 10.1038/ki.2013.149. Epub 2013 May 1.

The erythropoietin receptor is a downstream effector of Klotho-induced cytoprotection

Affiliations

The erythropoietin receptor is a downstream effector of Klotho-induced cytoprotection

Ming-Chang Hu et al. Kidney Int. 2013 Sep.

Abstract

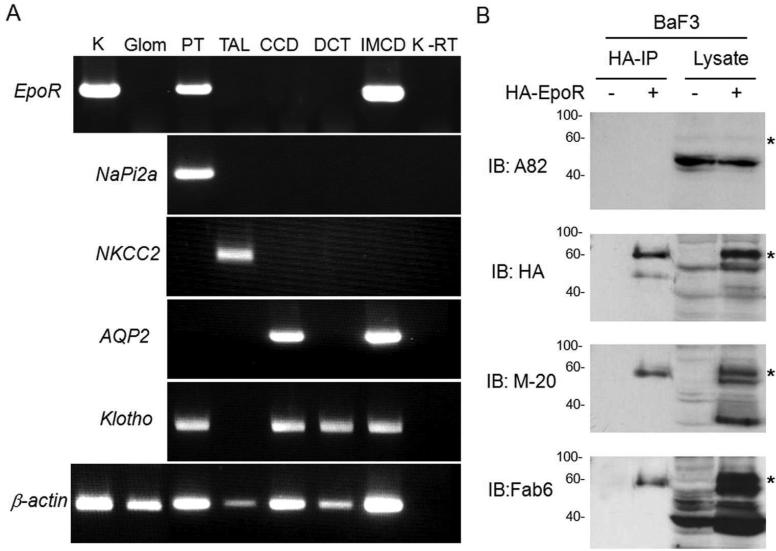
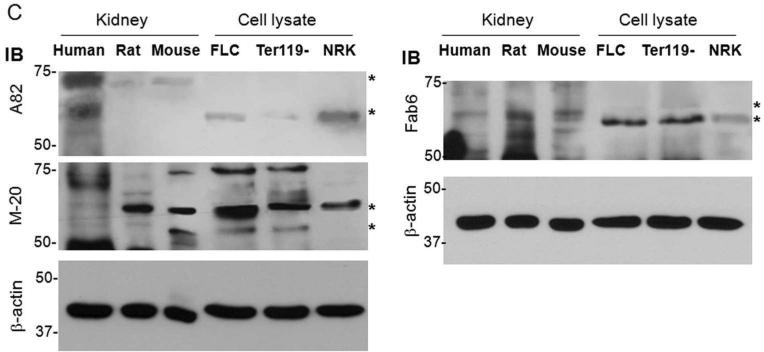
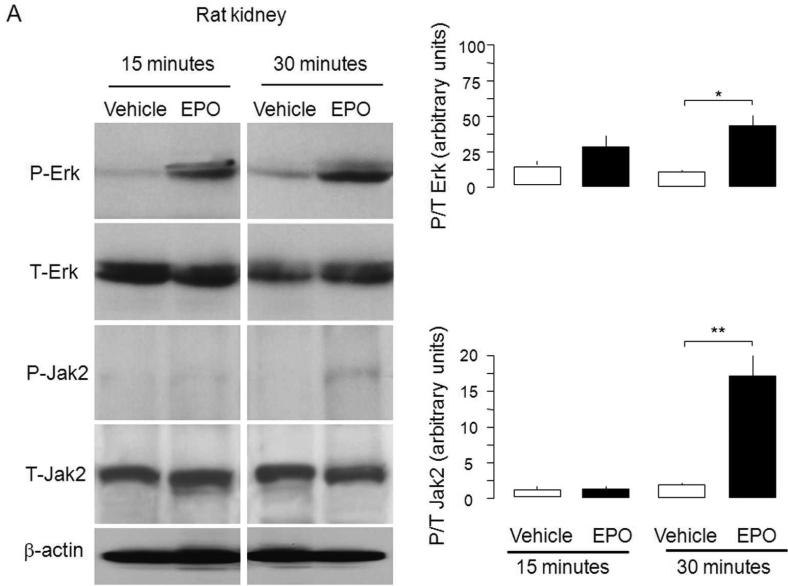
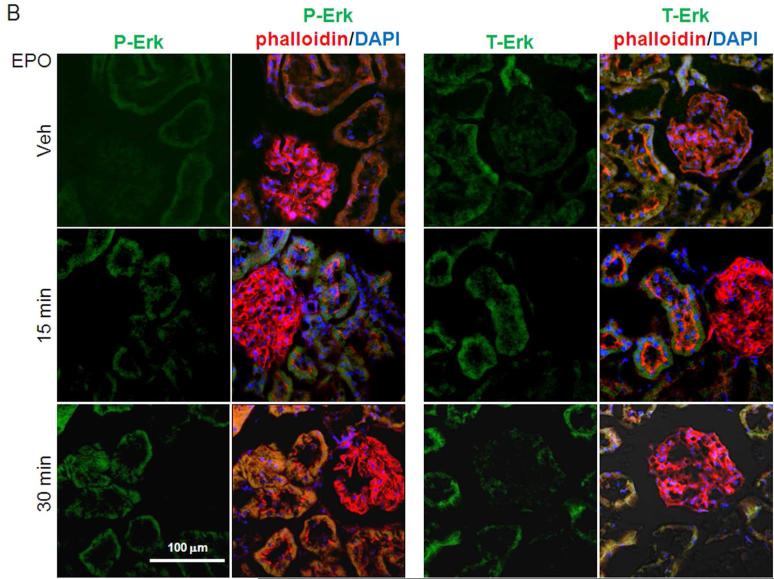
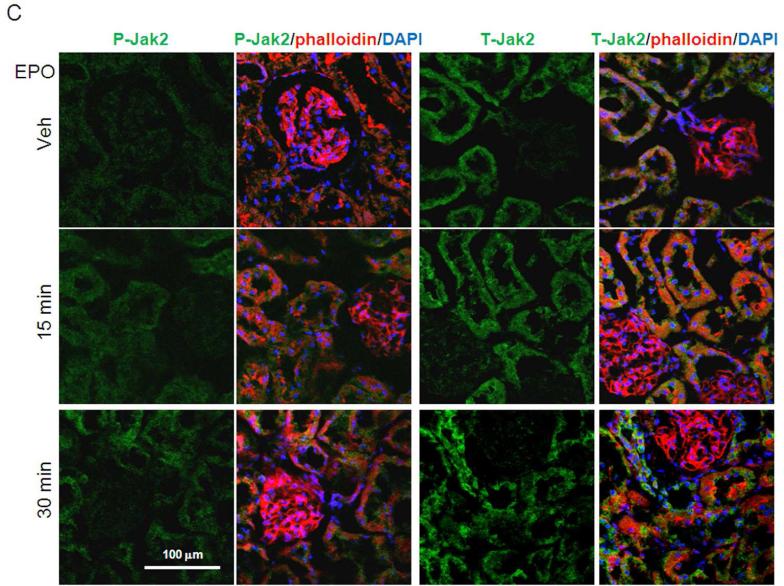
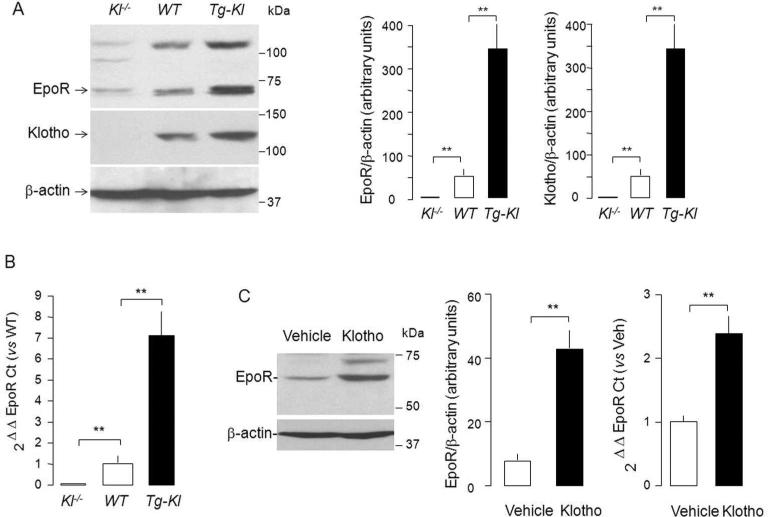
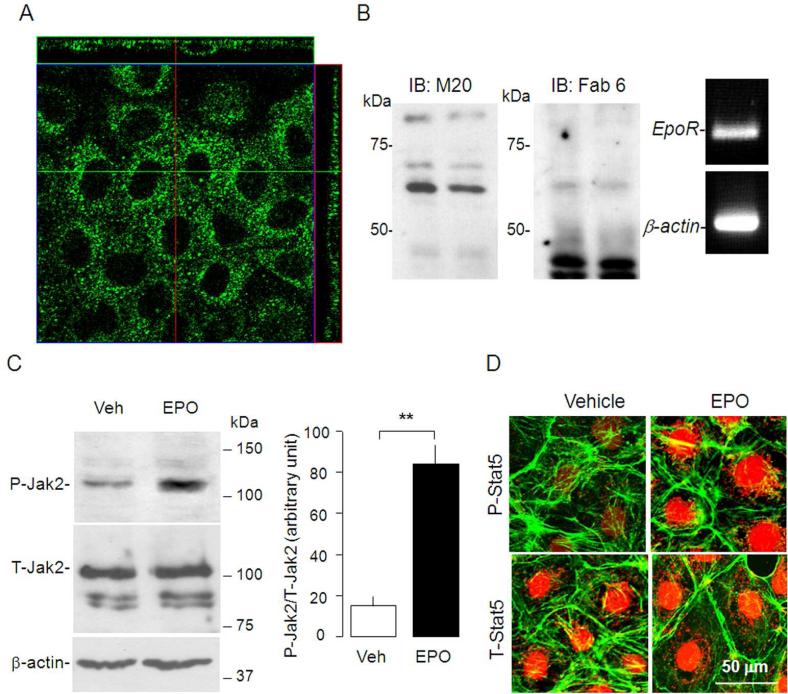
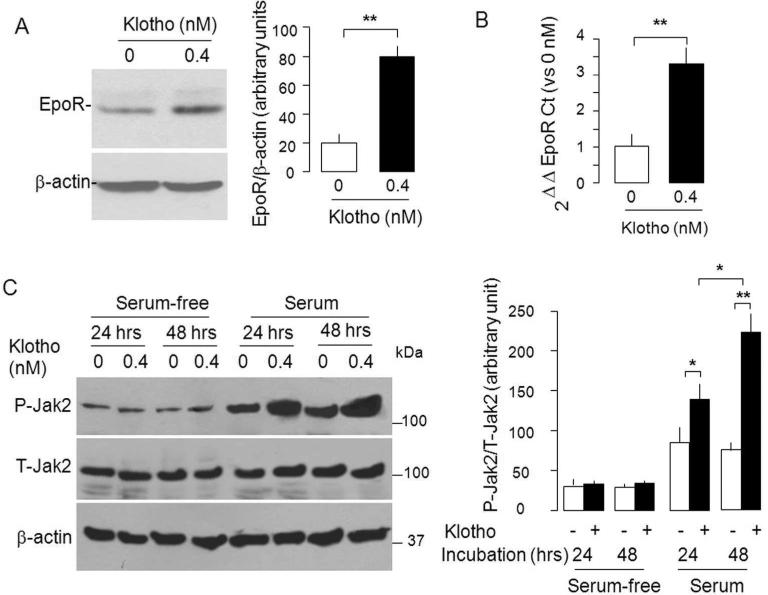
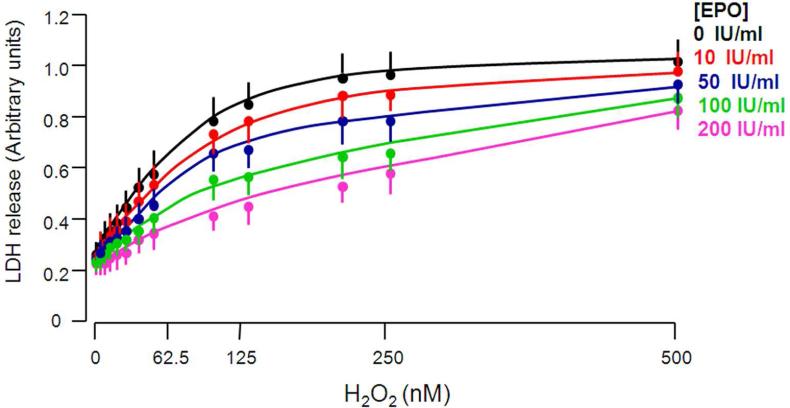
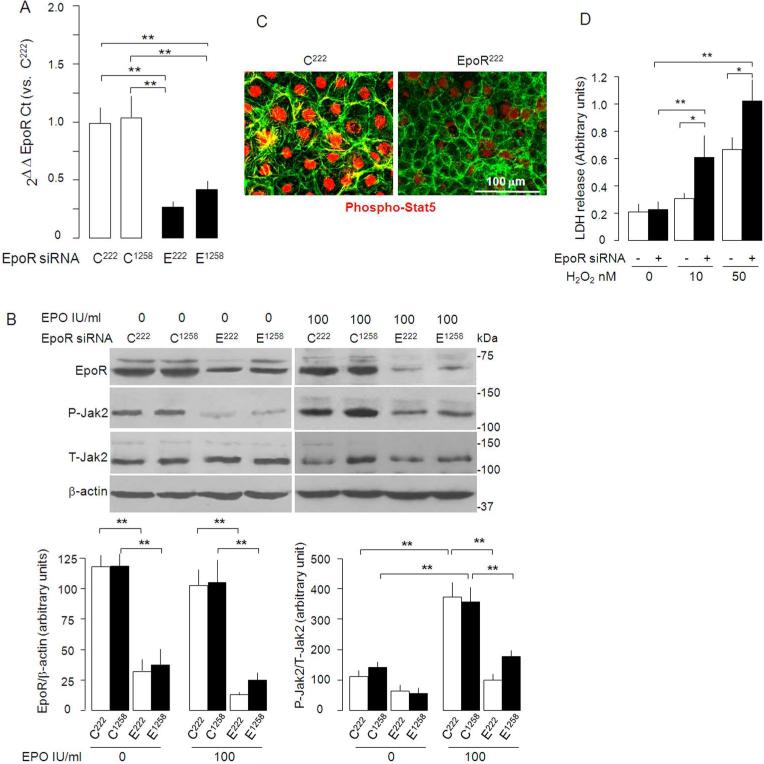
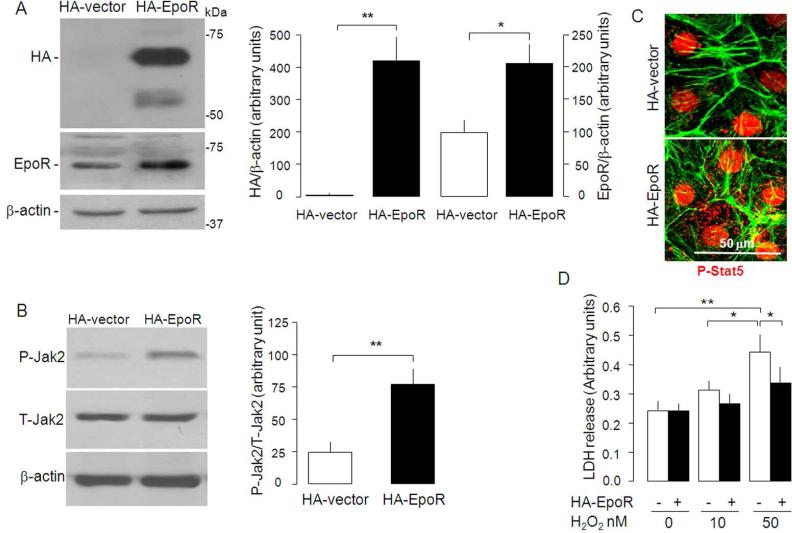
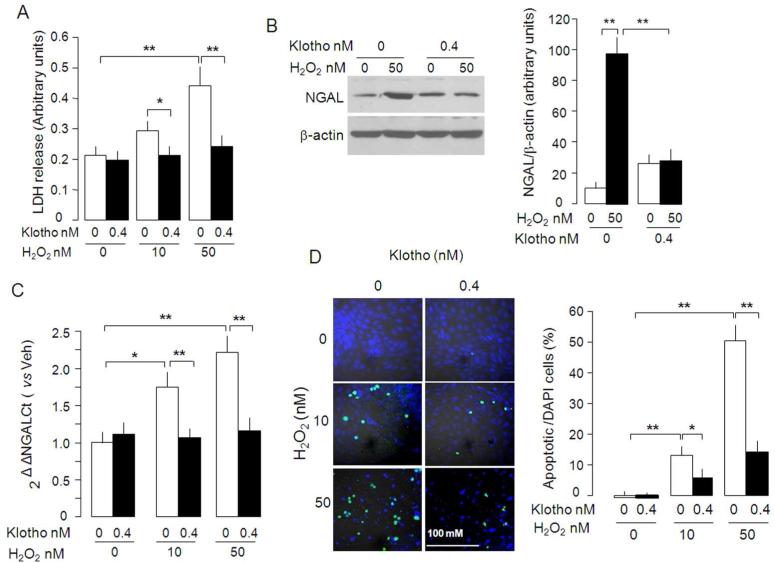
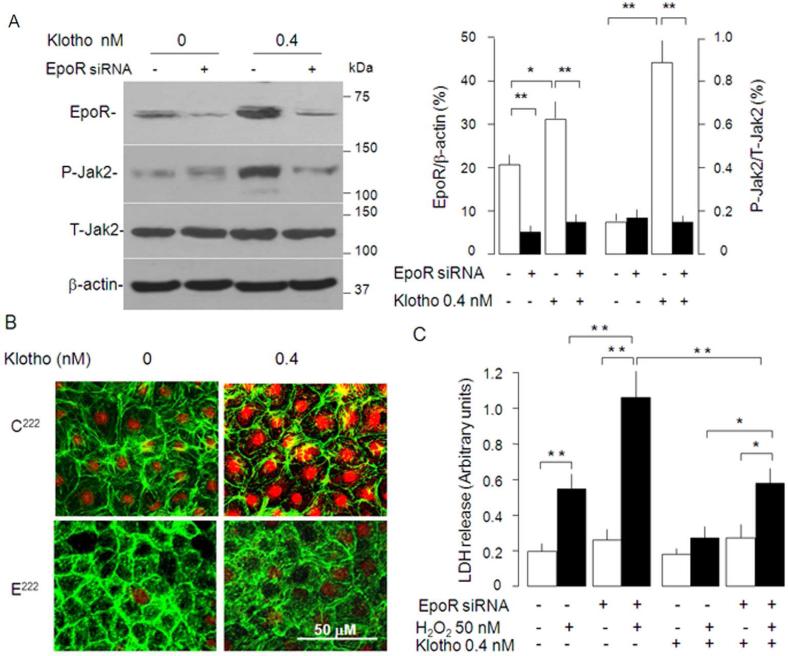
Although the role of the erythropoietin (EPO) receptor (EpoR) in erythropoiesis has been known for decades, its role in nonhematopoietic tissues is still not well defined. Klotho has been shown and EPo has been suggested to protect against acute ischemia-reperfusion injury in the kidney. Here we found in rat kidney and in a rat renal tubular epithelial cell line (NRK cells) EpoR transcript and antigen, and EpoR activity signified as EPo-induced phosphorylation of Jak2, ErK, Akt, and Stat5 indicating the presence of functional EpoR. Transgenic overexpression of Klotho or addition of exogenous recombinant Klotho increased kidney EpoR protein and transcript. In NRK cells, Klotho increased EpoR protein, enhanced EPo-triggered phosphorylation of Jak2 and Stat5, the nuclear translocation of phospho-Stat5, and protected NRK cells from hydrogen peroxide cytotoxicity. Knockdown of endogenous EpoR rendered NRK cells more vulnerable, and overexpression of EpoR more resistant to peroxide-induced cytotoxicity, indicating that EpoR mitigates oxidative damage. Knockdown of EpoR by siRNA abolished Epo-induced Jak2, and Stat5 phosphorylation, and blunted the protective effect of Klotho against peroxide-induced cytotoxicity. Thus in the kidney, EpoR and its activity are downstream effectors of Klotho enabling it to function as a cytoprotective protein against oxidative injury.


Figures

Figure 1
Figure 1. Expression of EpoR protein and mRNA in rat kidney
(A) EpoR mRNA expression in the rat kidney or microdissected glomeruli and renal tubules and from normal adult rats at age of 3 months old by RT-PCT. Total RNA was extracted, and complimentary DNA (cDNA) generated with Oligo dT. Specific target genes were examined by PCR with rat specific primers (shown in method section). AQP2: aquaporin-2; CCD: cortical collecting duct; DCT: distal convaluted tubules; Glo: glomeruli; IMCD: inner medullary collecting duct; K: Rat kidney tissue containing cortex and medullar; NaPi-2a: Na-Pi dependent cotransporter-2a; NKCC2: Na-K-2Cl cotransporter; PT: proximal tubules; TAL: thick ascending limb; K-RT: kidney sample with reverse transcriptase omitted; (B) EpoR protein expression in BaF3 cell transfected with HA-tagged mouse EpoR or empty vector. Total lysates from native BaF3 and BaF3-HA-EpoR cells were subjected to immunoprecipitation by HA-Resin followed by immunobloting for EpoR with several anti-EpoR antibodies: A82, HA, M-20, Fab 6. Asterisks depict the specific HA-EpoR band. (C) Total proteins were extracted from human and rodent kidneys and murine FLC and Ter119-cells, and subjected to immunobloting EpoR with several antibodies against EpoR. A82 is monoclonal rabbit antibody kindly provided by Dr. Steve Elliot; M-20 is polyclonal antibody purchased from Santa Cruz Biotech. Fab 6 is a synthetic human Fab against human EpoR isolated from a phage-displayed library. Asterisks indicate multiple forms of glycosylated EpoR or EpoR fragments. Hu: human; Mu: mouse; FLC: fetal liver cells at E13.5
Figure 2
Figure 2. Functional EpoR in rat kidney. EpoR activity was assessed by EPO-induced activation of downstream effectors in rat kidney assayed by determination of phosphorylation of Erk and Jak2
Renal artery was surgically isolated and EPO in oxygenated 1640 culture media (40 ml of 100 IU/ml) was continuously perfused for 15 minutes with Intravenous infusion system (Instech Laboratories, Inc, Plymouth Meeting, PA). After 15 minutes, kidneys were harvested for further study. (A) Left panel shows representative blots for phospho-Erk (P-Erk) and total Erk (T-Erk), and phospho-Jak2 (P-Jak2) and total Jak2 (T-Jak2). Summarized data (means ± SD) are shown in the right panel. (B) Representative immunohistochemistry for P-Erk and T-Erk in the kidney. (C) Representative immunohistochemistry for P-Jak2 and T-Jak2 in the kidney.
Figure 3
Figure 3. Genetic levels of Klotho correlates with levels of EpoR protein and mRNA expression in the kidney
(A) sixty mg protein of total kidney Lysate was loaded onto each lane, subjected to SDS-PAGL, and immunoblotted for EpoR and Klotho. EpoR and Klotho protein expression in mouse kidney (detected with KM206 and M-20 antibody respectively). Kl-/-= Klotho knock-out mice; WT=Wild type mice; Tg-Kl= transgenic Klotho overexpressing mice. Left panel: Typical blot. Right: Summarized data as means ± SD. (B) EpoR transcript level in mouse kidney by quantitative RT-PCR (qRT-PCR) expressed relative to wild type mouse and summarized as means ± SD. (C) Acute Klotho injection up-regulates EpoR protein and mRNA expression in rat kidney. Full length extracellular domain of recombinant mouse Klotho protein (rMKl) was injected intraperitoneally 0.01 mg/Kg body weight) once into rats and kidneys were harvested 24 hours later. EpoR protein was examined by immunoblot with M-20 and EpoR mRNA by qRT-PCR respectively. Typical immunoblot of EpoR protein (left panel), summarized data of EpoR protein (middle panel) and EpoR transcript by qRT-PCR (right panel). All bars and error bars are mean and SD. *p<0.05, **p<0.01 ANOVA followed by Student-Newman-Keuls test.
Figure 4
Figure 4. Expression of EpoR in NRK cells
(A) Immunocytochemistry for EpoR in NRK cells. Confocal fluorescent images in xy, yz, xz planes. (B) Left and middle panel: Representative immunoblots for EpoR with M-20 (left panel) and with Fab 6 (middle panel) in total lysate of NRK cells. Right panel: RT–PCR of EpoR transcript in NRK cells. (C) NRK cells incubated with culture media containing 10% FBS and treated with EPO (100 IU/ml) or vehicle (Veh) for 10 minutes and total lysates were immunobloted for phosphorylated Jak2 (P-Jak2) and total Jak2 (T-Jak2) (left panel). Summarized data as mean ± SD (right panel) (D) Representative immunocytochemistry for phospho-Stat5 (P-Stat5) and total Stat5 (T-Stat5) (red) in NRK cells treated with EPO or vehicle (Veh). β-actin (green) served as counterstain.
Figure 5
Figure 5. Klotho regulates EpoR protein, mRNA, and signaling in NRK cells
NRK cells were treated with Klotho in cell culturere medium containing 10% FBS for 24 hours. (A) Typical immunoblot for EpoR (left panel) and data summarized as means ± SD (right panel). (B). EpoR mRNA by qPCR. Cyclophilin served as control. Means ± SD of 4 independent experiments. **p< 0.01 unpaired Student t-test. (C).NRK cells were incubated with Klotho protein in medium containing 10% FBS for 24 and 48 hours. Total lysates were immunoblotted for phosphorylated (P-Jak2) and total Jak2 (T-Jak2) (left panel). Summarized data as means ± SD (right panel) of 4 independent experiments. *p<0.05, **p<0.01 ANOVA followed by Student-Newman-Keuls test.
Figure 6
Figure 6. EPO protects NRK cells from H2O2-induced cytotoxicity
NRK cells were treated with different concentrations of EPO and H2O2 as shown in regular cell culture medium containing 10% FBS for 24 hours and supernatants were collected for LDH assay.
Figure 7
Figure 7. EpoR is required for EPO cytoprotection against H2O2
Knockdown of endogenous EpoR by siRNA was confirmed by qRT-PCR to quantify EpoR mRNA shown as means ± SD from 4 independent experiments (A). E222 and E1258 are EpoR siRNA's at indicated sequences locations, C222 and C1258 are as corresponding scrambled controls C222 and C1258). EpoR222 siRNA knocked down EpoR mRNA by 76.3 ± 5.0%, while EpoR1258 siRNA by 56.9 ± 3.9%. (B) EpoR protein and Jak2 phosphorylation in NRK cells incubated with culture medium containing 10% FBS and treated with EpoR or control siRNA. Representative blot (left panel) and summarized data as percentage of C222 (right panel). (C) Effect of EpoR knockdown on phosphorylation and nuclear translocation of Stat5 (red). (D) Effect of EpoR knockdown on susceptibility of NRK cells to H2O2. Means±SD from 4 independent experiments *p<0.05, **P<0.01 by ANOVA followed by Student-Newman-Keuls test. E222=EopR222, E1258=EpoR1258, C222=Control222, C1258=Control1258.
Figure 8
Figure 8. Effect of overexpression of EpoR on H2O2 toxicity in NRK cells
(A) NRK cells were transfected with HA-tagged EpoR and growth in cell culture medium containing 10% FBS. Total cell lysates were subjected to SDS-PAGE followed by immunobloting with anti-HA and anti-EpoR. Typical blot (left panel) and summarized data as means ± SD (right panel). *p<0.05 **p<0.01 by Student t test. (B) HA-EpoR overexpression and EPO-induced phosphorylation of Jak2. Typical blot (left panel) and summarized data as means ± SD (right panel). **p<0.01 by Student t test. (C) Effect of HA-EpoR overexpression on phosphorylation and translocation of Stat5. P-Stat5=phosph-Stat5. (D) Effect of EpoR overexpression on H2O2 cytotoxicity in NRK cell's. Means ± SD from 4 independent experiments *p<0.01 by ANOVA followed by Student-Newman-Keuls test.
Figure 9
Figure 9. Effect of soluble Klotho protein on H2O2-induced cytotoxicity in NRK cells
(A) NRK cells were treated with H2O2 in culture medium containing 10% FBS with or without Klotho (0.4 nM) for 1 day. The culture media were collected for LDH release assay. (B) Cell lysates were immunoblotted for NGAL protein (left panel) and summarized data as mean ± SD from 4 independent experiments. (C) NGAL mRNA quantified by RT-qPCR’ relative to no Klotho and no H2O2. (D). Apoptotic cells detected by TUNEL assay (left panel). The ratio of apoptotic cells (TUNEL+) over total cells (DAPI+) (right panel). Means ± SD from 4 independent experiments. Differences between groups were statistically analyzed by ANOVA followed by Student-Newman-Keuls test. *p<0.05, **p<0.01.
Figure 10
Figure 10. Effect of knock-down of EpoR on the cytoprotection by Klotho
(A) NRK cells with or without EpoR knockdown was treated with Klotho in cell culture medium containing 10% FBS and EpoR signaling was assayed as phospho-Jak. Typical blot (left panel) and means ± SD (right panel) (B). NRK cells with and without EpoR knock-down were treated with Klotho and EpoR signaling was measured as phosphorylation and translocation of Stat5. (C) Effect of EpoR knock-down on H2O2-induced cytotoxicity in NRK cells. Means ± SD from 4 independent experiments. Differences between groups statistically analyzed by ANOVA followed by Student-Newman-Keuls test. *p<0.05, **p<0.01.

Comment in

References

    1. David RB, Lim GB, Moritz KM, et al. Quantitation of the mRNA levels of Epo and EpoR in various tissues in the ovine fetus. Mol Cell Endocrinol. 2002;188:207–218. - PubMed
    1. Moritz KM, Lim GB, Wintour EM. Developmental regulation of erythropoietin and erythropoiesis. Am J Physiol. 1997;273:R1829–1844. - PubMed
    1. Wintour EM, Butkus A, Earnest L, et al. The erythropoietin gene is expressed strongly in the mammalian mesonephric kidney. Blood. 1996;88:3349–3353. - PubMed
    1. Wu H, Liu X, Jaenisch R, et al. Generation of committed erythroid BFU-E and CFU-E progenitors does not require erythropoietin or the erythropoietin receptor. Cell. 1995;83:59–67. - PubMed
    1. Bartesaghi S, Marinovich M, Corsini E, et al. Erythropoietin: a novel neuroprotective cytokine. Neurotoxicology. 2005;26:923–928. - PubMed

Publication types

MeSH terms