

Spectrotemporal modulation sensitivity as a predictor of speech intelligibility for hearing-impaired listeners
- PMID: 23636210
- PMCID: PMC3973426
- DOI: 10.3766/jaaa.24.4.5
Spectrotemporal modulation sensitivity as a predictor of speech intelligibility for hearing-impaired listeners
Abstract
Background: A model that can accurately predict speech intelligibility for a given hearing-impaired (HI) listener would be an important tool for hearing-aid fitting or hearing-aid algorithm development. Existing speech-intelligibility models do not incorporate variability in suprathreshold deficits that are not well predicted by classical audiometric measures. One possible approach to the incorporation of such deficits is to base intelligibility predictions on sensitivity to simultaneously spectrally and temporally modulated signals.
Purpose: The likelihood of success of this approach was evaluated by comparing estimates of spectrotemporal modulation (STM) sensitivity to speech intelligibility and to psychoacoustic estimates of frequency selectivity and temporal fine-structure (TFS) sensitivity across a group of HI listeners.
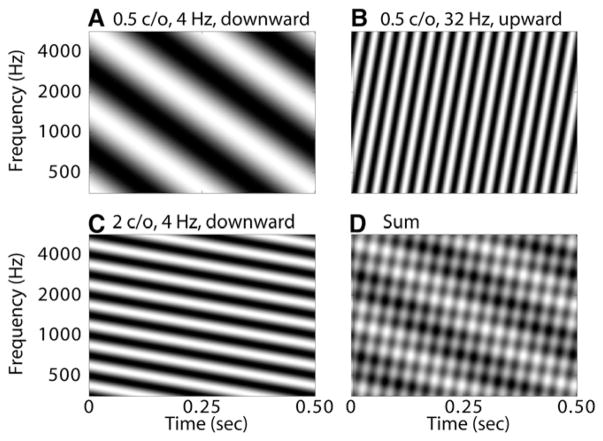
Research design: The minimum modulation depth required to detect STM applied to an 86 dB SPL four-octave noise carrier was measured for combinations of temporal modulation rate (4, 12, or 32 Hz) and spectral modulation density (0.5, 1, 2, or 4 cycles/octave). STM sensitivity estimates for individual HI listeners were compared to estimates of frequency selectivity (measured using the notched-noise method at 500, 1000, 2000, and 4000 Hz), TFS processing ability (2 Hz frequency-modulation detection thresholds for 500, 1000, 2000, and 4000 Hz carriers) and sentence intelligibility in noise (at a 0 dB signal-to-noise ratio) that were measured for the same listeners in a separate study.
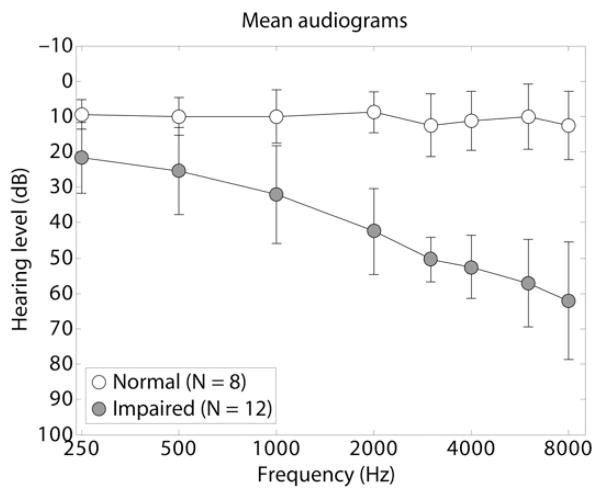
Study sample: Eight normal-hearing (NH) listeners and 12 listeners with a diagnosis of bilateral sensorineural hearing loss participated.
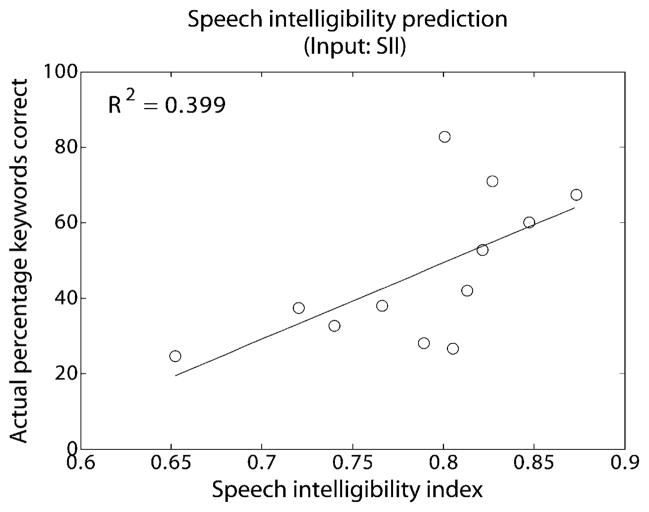
Data collection and analysis: STM sensitivity was compared between NH and HI listener groups using a repeated-measures analysis of variance. A stepwise regression analysis compared STM sensitivity for individual HI listeners to audiometric thresholds, age, and measures of frequency selectivity and TFS processing ability. A second stepwise regression analysis compared speech intelligibility to STM sensitivity and the audiogram-based Speech Intelligibility Index.
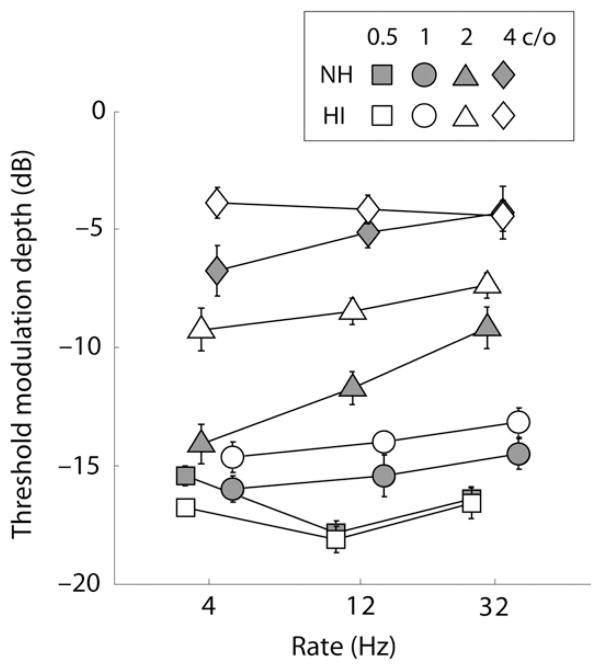
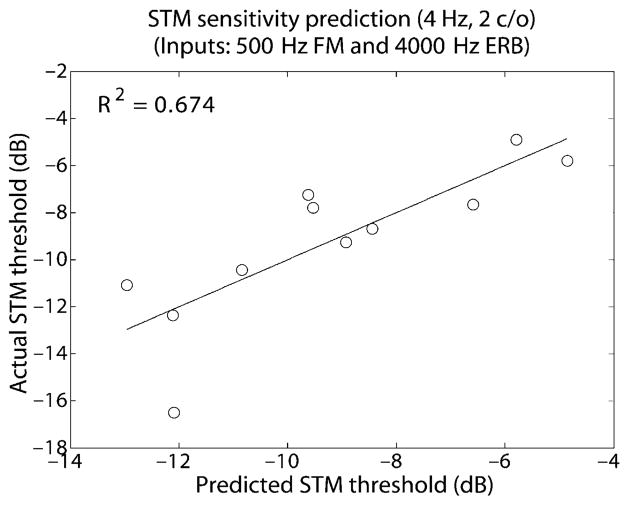
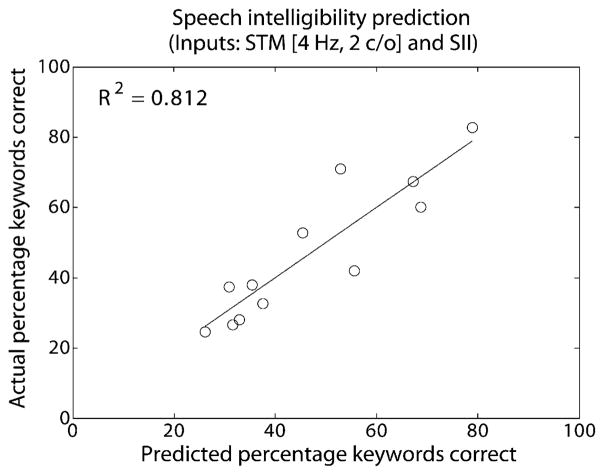
Results: STM detection thresholds were elevated for the HI listeners, but only for low rates and high densities. STM sensitivity for individual HI listeners was well predicted by a combination of estimates of frequency selectivity at 4000 Hz and TFS sensitivity at 500 Hz but was unrelated to audiometric thresholds. STM sensitivity accounted for an additional 40% of the variance in speech intelligibility beyond the 40% accounted for by the audibility-based Speech Intelligibility Index.
Conclusions: Impaired STM sensitivity likely results from a combination of a reduced ability to resolve spectral peaks and a reduced ability to use TFS information to follow spectral-peak movements. Combining STM sensitivity estimates with audiometric threshold measures for individual HI listeners provided a more accurate prediction of speech intelligibility than audiometric measures alone. These results suggest a significant likelihood of success for an STM-based model of speech intelligibility for HI listeners.
American Academy of Audiology.
Figures
Comment in
-
Conclusion: predicting speech intelligibility by individual hearing-impaired listeners: the path forward.J Am Acad Audiol. 2013 Apr;24(4):329-36. doi: 10.3766/jaaa.24.4.7. J Am Acad Audiol. 2013. PMID: 23636212 No abstract available.
References
-
- American National Standards Institute (ANSI) Methods for Calculation of the Speech Intelligibility Index, S3.5. New York: American National Standards Institute; 1997.
-
- Bacon SP, Gleitman RM. Modulation detection in subjects with relatively flat hearing losses. J Speech Hear Res. 1992;35(3):642–653. - PubMed
-
- Bacon SP, Viemeister NF. Temporal modulation transfer functions in normal-hearing and hearing-impaired listeners. Audiology. 1985;24(2):117–134. - PubMed
-
- Bernstein LR, Green DM. The profile-analysis bandwidth. J Acoust Soc Am. 1987;81(6):1888–1895.
-
- Buss E, Hall JW, Grose JH. Temporal fine-structure cues to speech and pure tone modulation in observers with sensorineural hearing loss. Ear Hear. 2004;25(3):242–250. - PubMed
Publication types
MeSH terms
Grants and funding
LinkOut - more resources
Full Text Sources
Other Literature Sources
Miscellaneous
