

Review
doi: 10.1152/physiol.00055.2012.
Transduction of voltage and Ca2+ signals by Slo1 BK channels
Affiliations
- PMID: 23636263
- PMCID: PMC3742125
- DOI: 10.1152/physiol.00055.2012
Item in Clipboard
Review
Transduction of voltage and Ca2+ signals by Slo1 BK channels
Physiology (Bethesda).
2013 May.
Abstract
Large-conductance Ca2+ -and voltage-gated K+ channels are activated by an increase in intracellular Ca2+ concentration and/or depolarization. The channel activation mechanism is well described by an allosteric model encompassing the gate, voltage sensors, and Ca2+ sensors, and the model is an excellent framework to understand the influences of auxiliary β and γ subunits and regulatory factors such as Mg2+. Recent advances permit elucidation of structural correlates of the biophysical mechanism.
Conflict of interest statement
No conflicts of interest, financial or otherwise, are declared by the author(s).
Figures
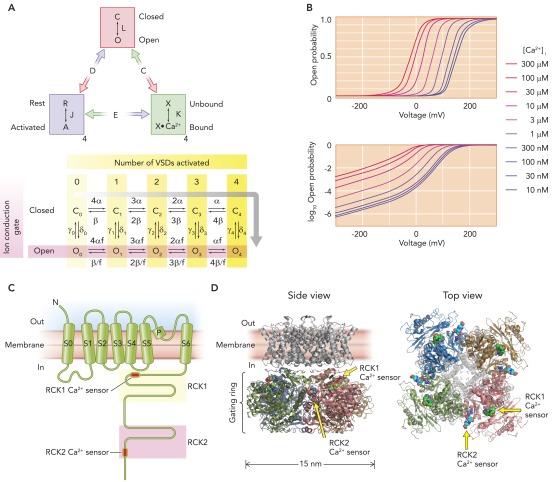
The Horrigan and Aldrich model of gating A: the Horrigan and Aldrich (HA) model of gating of the Slo1 channel. L, J, and K are equilibrium constants describing the ion conduction gate, the voltage sensor, and the Ca2+ binding site, respectively. D, C, and E are allosteric interaction factors. For example, activation of one voltage sensor increases the value of L by D times, and activation of all four voltage sensors increases L by D4. The kinetic model below the equilibrium model describes the channel behavior in the absence of Ca2+. C0–4 are nonconducting states, and O0–4 are conducting states. The subscript number refers to the number of VSDs activated. For example, C0 means that the ion conduction gate is closed and all four VSDs are at rest, and O4 means that the ion conduction gate is open and all four VSDs are activated. α, β, γ0–4, and δ0–4 are rate constants. D = f2. The gray bent arrow indicates the likely activation pathway on moderate to large depolarization. B: voltage dependence of open probability of a typical human Slo1 channel predicted by the HA model on linear (top) and semilogarithmic (bottom) scales with different [Ca2+]i. The graphs are for an illustrative purpose only. C: a schematic organization of one pore-forming Slo1 (α) polypeptide. Not drawn to scale. Of ∼1,100 residues found in a typical Slo1 polypeptide, only ∼320 residues are in the NH2 terminus through S6. D: a plausible three-dimensional structural organization of a human Slo1 BK channel. The probable Ca2+ sensor locations are indicated by the two arrows. The transmembrane domain is a homology model based on a structure of a voltage-gated K+ channel (PDB 2R9R), and the cytoplasmic domain is from PDB 3NAF obtained in the absence of added Ca2+ but without any Ca2+ chelator. The transmembrane segment S0 is not shown since the Kv channel lacks S0. The image was rendered in MacPyMol version 0.99. The spacing between the transmembrane domain and the cytoplasmic domain is only approximate. The transmembrane domain at right is made semi-transparent to better illustrate the gating ring domain.
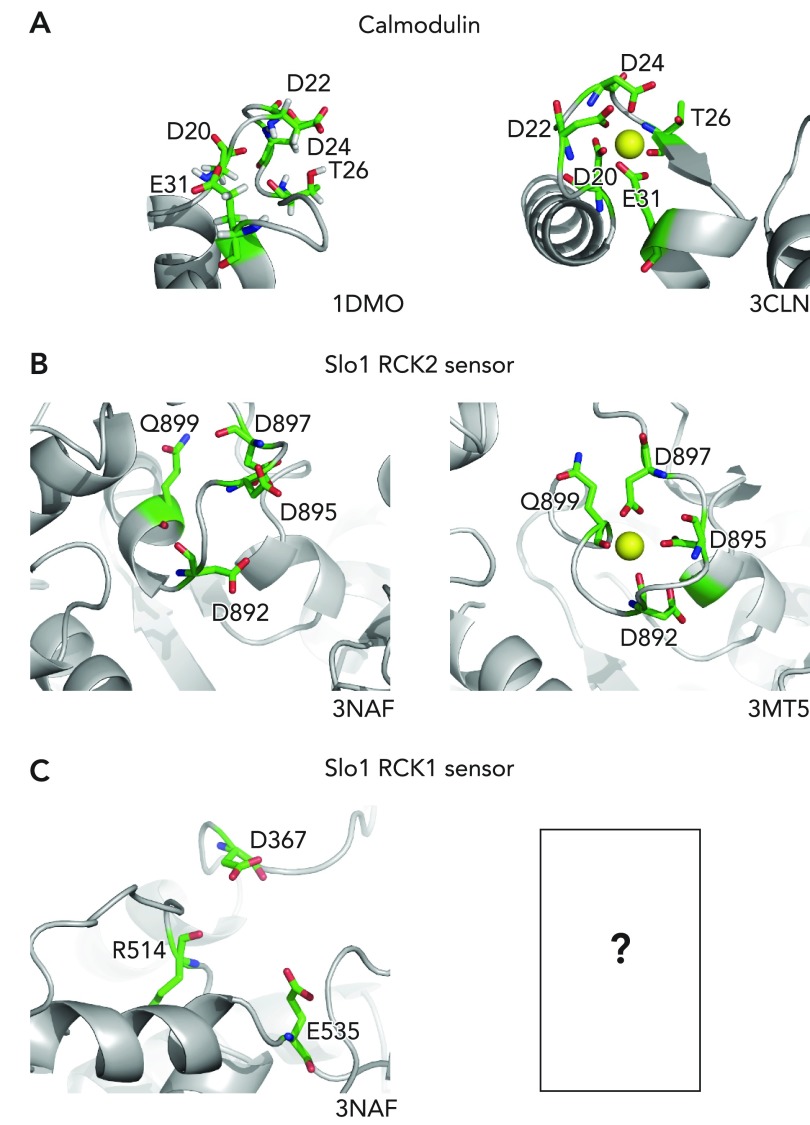
Ca2+ coordination Ca2+ coordination in calmodulin (A), the Slo1 RCK2 sensor (B), and the Slo1 RCK1 sensor (C). For each, the Ca2+-free apo structure is shown at left and the Ca2+-bound structure is shown at right. The image was rendered in MacPyMol version 0.99. The Ca2+-ligating residues are shown using sticks. Ca2+: yellow sphere; carbon: green; nitrogen: blue; oxygen: red. Water molecules participate in Ca2+ coordination, but they are not shown.
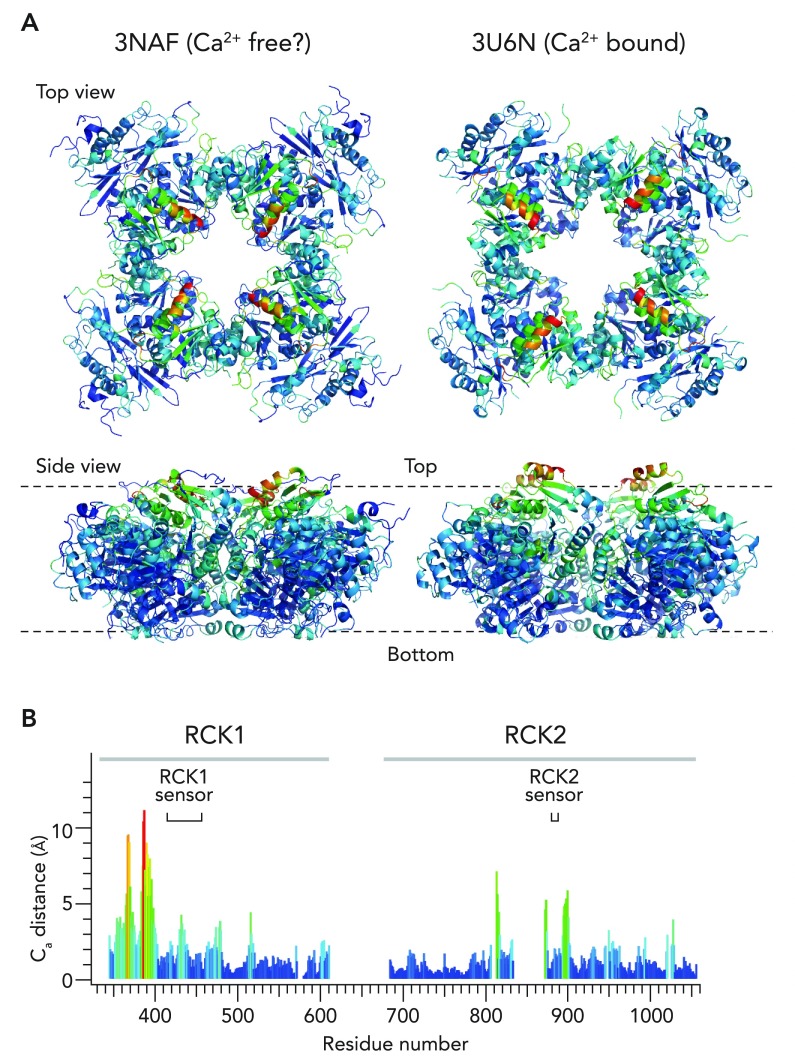
Potential changes in the conformation of the cytoplasmic gating ring domain by Ca2+ A: atomic structures of the human Slo1 gating ring domain (PDB 3NAF) obtained without Ca2+ (but without any Ca2+ chelator) and of the zebrafish Slo1 gating ring domain with Ca2+ bound to the RCK2 sensor but not to the RCK1 sensor (PDB 3U6N) are compared. The colors represent the distances between the corresponding α carbons in the two structures. Red: 11 Å; purple: 0 Å. B: distances between the α carbons of the corresponding residues in 3NAF and 3U6N. The residue numbers represent those in human Slo1 as in 3NAF. The structures were analyzed and rendered in MacPyMol version 0.99.
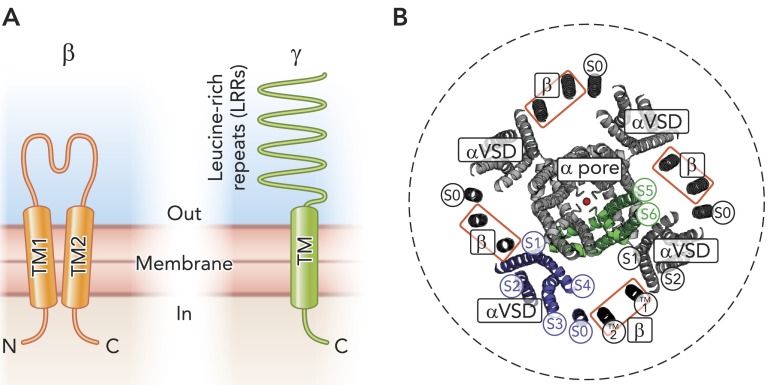
Auxiliary subunits of Slo1 A: schematic organizations of prototypical β and γ (LRRC) subunits. Not drawn to scale. B: probable relative positions of Slo1 and β subunits viewed from the extracellular side. The Slo1 transmembrane structure is based on a homology model. Each Slo1 (α) subunit consists of seven transmembrane helices, of which S0–S4 make up a voltage-sensing domain (VSD, green), whereas S5–S6 (green) contribute to the central, the K+-selective pore (a conducting K+ is shown in red). Auxiliary β subunits possess two transmembrane (TM) helices (black), of which TM2 associates with α subunit S0, whereas TM1 associates with S1 of a neighboring α subunit (80). S0, TM1, and TM2 were constructed as ideal α helices and positioned according to Liu et al. (80). The dashed circle represents the size of the cytoplasmic gating ring domain (∼15 nm in diameter).
References
-
- Adelman JP, Shen KZ, Kavanaugh MP, Warren RA, Wu YN, Lagrutta A, Bond CT, North RA. Calcium-activated potassium channels expressed from cloned complementary DNAs. Neuron 9: 209–216, 1992 - PubMed
-
- Altura BM, Altura BT, Gupta RK. Alcohol intoxication results in rapid loss in free magnesium in brain and disturbances in brain bioenergetics: relation to cerebrovasospasm, alcohol-induced strokes, and barbiturate anesthesia-induced deaths. Magnes Trace Elem 10: 122–135, 1991 - PubMed
-
- Altura BM, Zhang A, Cheng TP, Altura BT. Ethanol promotes rapid depletion of intracellular free Mg in cerebral vascular smooth muscle cells: possible relation to alcohol-induced behavioral and stroke-like effects. Alcohol 10: 563–566, 1993 - PubMed
Publication types
MeSH terms
Substances
Grants and funding
LinkOut - more resources
Full Text Sources
Other Literature Sources
Miscellaneous